Present Smart Home Smartly: Apply IoT graphics
Explaining what is a smart home, how does the Internet of Things works in the context of private houses may require some effort. Like for many other complex IT topics, illustrating your slides with a scheme and icons can increase the presentation readability. See examples of IoT visuals applied in the connected home sector.
Home automation is gaining popularity nowadays. With lowering cost of connected sensors, WiFi cameras, we moved from B2B markets to a massive B2C industry. If you are a provider or smart devices or an end-user, you can find handy to use IoT symbols to illustrate your Smart home projects.
>> download an editable Connected Home IoT Icons collection
We designed not only icons but whole templates and diagrams, that are ready to be reused and adapted for any illustrations, in PowerPoint or other applications, after the simple images export.
Below you can see the examples of using simple IoT diagrams created in PowerPoint. All shapes are fully editable so you can adapt their colors, move or copy them into your slides.
Present Smart Home Devices Distribution and Control over Internet
Smart house and smart home control illustration examples
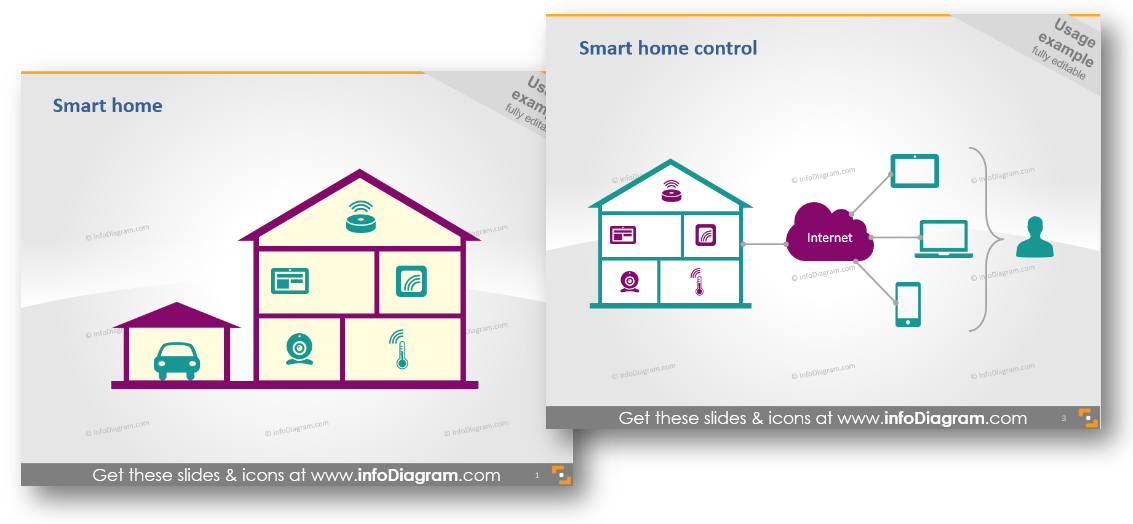
If you want to show how smart sensors and various connected devices are located in a house, check the slide above. That’s the example of smart home outline graphics: it is possible to change the shape of the building, move the room rectangles, add or remove an IoT device symbol you need (look or the whole list here or at the end of the blog).
To illustrate the power of connection – a possibility to control all connected devices remotely, see the second picture. Notice how we added a simple a cloud to present remote smart home control over the Internet using mobile devices.
Explaining IoT Applications by Simple Diagram List
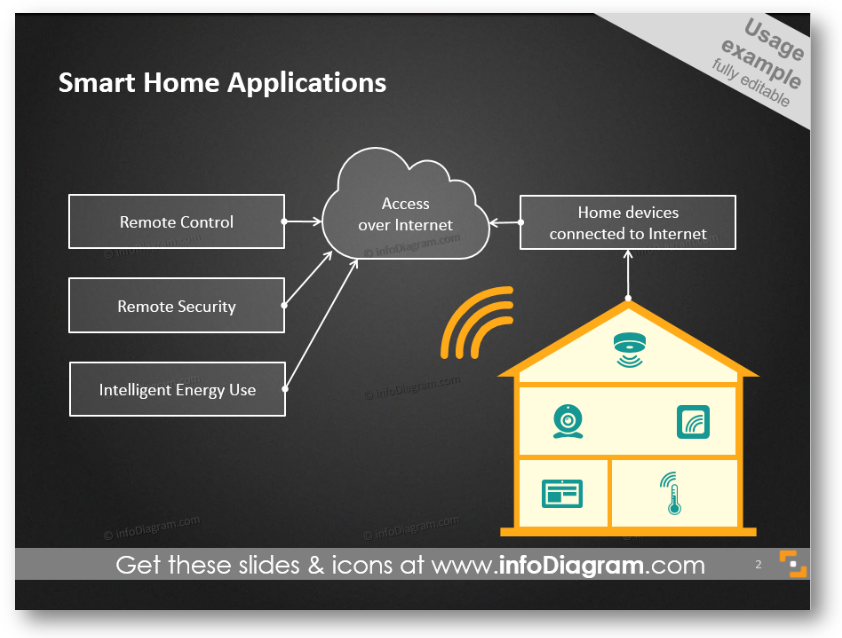
Smart home application diagram: from home devices connected to the internet to remote control and security
To create a visual explanation of application that Smart Home enables, do a simple process diagram. Use standard PowerPoint shapes to create a flowchart, cloud shape to represent Access over the Internet and connected home illustration. Making the presentation slide with the dark background will make it less typical and it will stand out. We listed here three applications (Remote Control, Security, and Intelligent Energy Consumption) but you can expand further the list.
The connected home topic can be sometimes hard for understanding, that’s why visualizing concepts will help you to bring the right ideas to the audience.
Illustrating Benefits of Connected Home
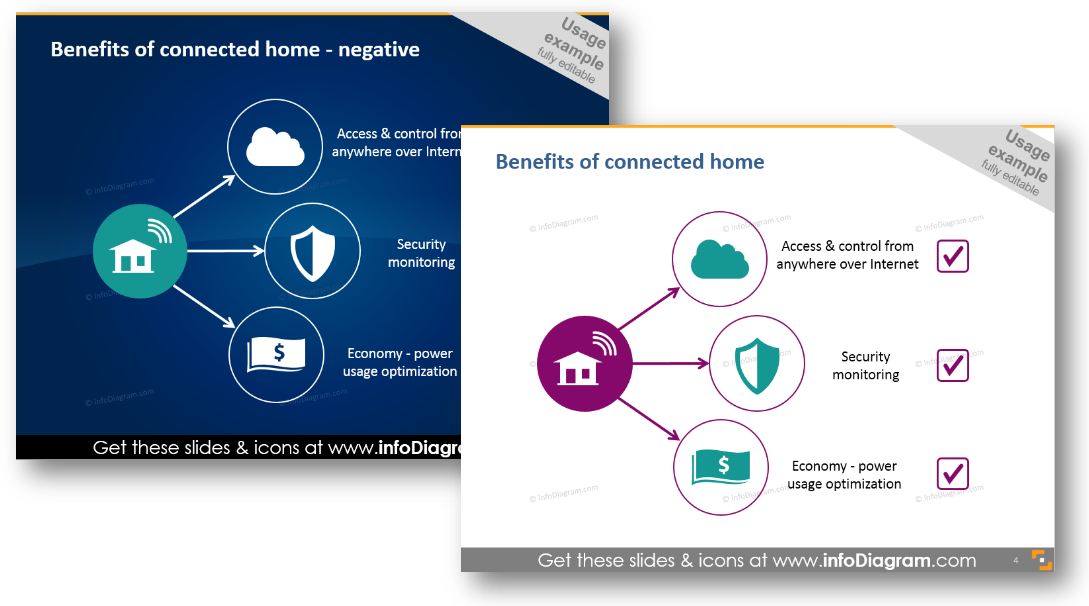
Benefits of connected home diagram examples: white and dark background
Listing the benefits that a house with smart devices offers can also be done in a more attractive way, than just plain bullet-points list. Represent each benefit with an icon, to create the visual association. For Internet Access and Control we used cloud icon, for security and monitoring a shield sign and for economic benefits we added a banknote symbol, to show smart home can save money by power consumption optimization.
Icons instead of bullet points or text boxes look better on the slide, as you can see from the example. Again here you can apply negative colors – dark blue background with white diagram and symbols. Even though it’s less suitable for printing, but for a screen projection, it’s more eye-catching.
Besides adding these shapes to PowerPoint slide, you can use them also in other documents – eBooks, Excel sheets, also Keynote, Prezi and other tools. For MS Office apps a simple copy & paste of the data chart or symbols will work. For other tools (Canva, Prezi..) saving icons as an image and adding them as a picture will do the work too.
What’s inside the Connected Home Internet of Things set?
The collection contains graphics library for creating a presentation on the Connected Home topic. It consists of:
- Usage examples:
- Smart Home outline graphics
- Process diagram and connections schema of Smart Home Applications
- Smart home control and benefits of connected home. Symbols of security monitoring and power usage optimization.
- Connected Intelligent House equipment symbols for PowerPoint
- Different types of connected houses and connected buildings (garage, family house, office building)
- Monitoring sensors device: vision sensor, video monitoring, camera, a smart sensor, smoke detector
- Examples of control devices: on the wall display, tablet with the app, mobile devices, tablet
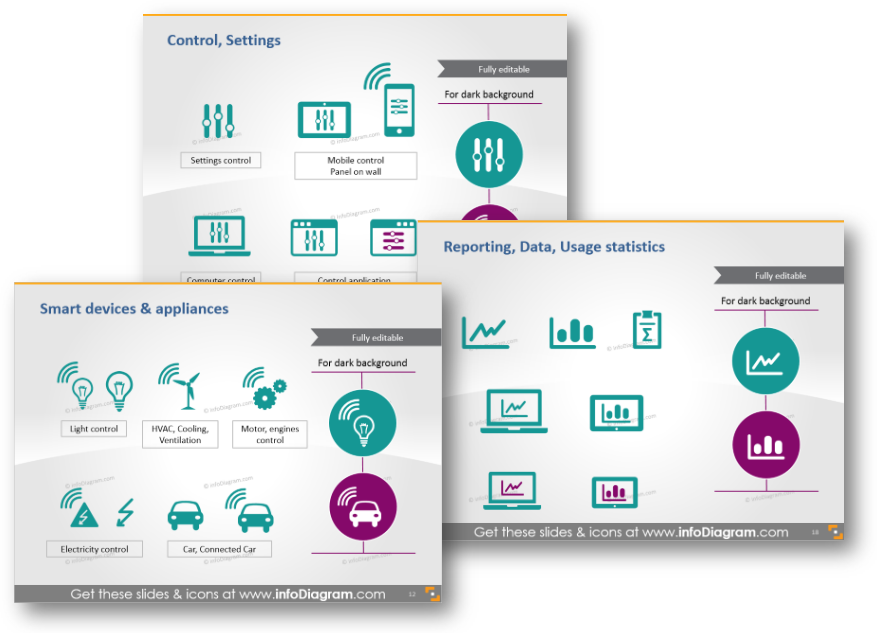
- Control and settings icons
- Smart devices and appliances: light control or motor/engines control
- Symbols of monitoring temperature, fire, smoke, humidity
- Graphics of: house outline, office building outline
- Different security and protection icons
- Icons of reporting, data, usage statistics
- Connection symbols: Wireless, Wi-Fi, network,
- IT server, Database, Cloud, Global connections
- User and status symbols
Using only PowerPoint or Keynote, you can easily draw a connected home with all IoT equipment, create a diagram illustrating any IoT process, structure, IT system communication flow.
All icon clip art and diagram templates above are from our infoDiagram PowerPoint Diagrams collection. It contains icons and shapes for enhancing PowerPoint presentations, which can be easily edited and added to your slides.
You can get a PowerPoint editable version of all IoT slides set here.
If you have any question or suggestions, leave us a question here, we will gladly help.