Data Visualization PPT: 4 Chart Fixes for Managers
By Peter, infoDiagram Co-founder & Data Visualization Specialist · 15+ years designing data presentations for corporate clients · Updated May 2026
TL;DR – How to improve a data visualization slide in 4 steps: (1) Use color to highlight one key data point, mute everything else. (2) Add a fly-out callout — a circle, arrow, or annotation — pointing to the number that matters. (3) Replace category labels with intuitive icons so the chart is readable in 2 seconds. (4) Turn standalone numbers and KPIs into infographic shapes, not raw text. The goal: a chart your CFO or board can grasp without you having to walk them through it.
If you’re a finance manager building the monthly business review or an operations leader showing performance trends to the board — you’ve faced this slide. Three pivot tables, a bar chart, two callouts, and a footnote, all fighting for attention. The data is right, but the slide is unreadable. Below are four design moves I use when redesigning corporate decks to turn dense data slides into single-message visuals.
Creating eye-catching and clear visuals to accompany and represent numerical information can be a hell of a challenge sometimes. Especially if you’re under time pressure.
Let me share a few design approaches to good data visualization. Applying those tips will show your audience you know your topic and that they are able to understand it, as well.
- Analyze the message you want to pass on in your presentation. Do you want to compare various category sales? Show an untypical value, an outliner? Present an increasing or decreasing trend? Once you have that main information, make it stand out.
- Declutter the content. Ask yourself if all that data must be present on a slide? Maybe that one message is enough? If you need to show all the data because of giving context, make them less visible than the main part. Sometimes a color change will do.
- Make data attractive to look at. Illustrate categories, and assign various colors. You can use animation to show how data evolved.
Here are four simple graphical ways to quickly improve your next data-driven talk:
1. Use color to focus on the most important message
Most data slides I see are overloaded with information. If you’re including data in your presentation, it is generally to prove a certain point or convey one piece of information. You don’t want just to show a bunch of numbers but pass the message data tell.
Therefore if you can’t just show the outcome but you want to give also a context, it is crucial to highlight that one key message. And one way to do that is to use distintive color.
Why this works: Pre-attentive processing — the brain registers a single contrasting color in under 200ms, before conscious reading starts. Use it deliberately.
If you work on a corporate deck, you usually have color palette to use. I hope it does one color that is used to be a highlighter – a color that stands out. If you don’t have such color, choose some of additional colors (ideally you can use a color wheel to find the most contrastive color to colors you use on slide). You can use colors that stand out such as orange, dark red or green, but be aware those colors have also special meaning e.g. in financial context red means negative numbers.
Design tip: Don’t highlight too much. Aim for no more than 10 or 20% of the data or content, to make it stand out.
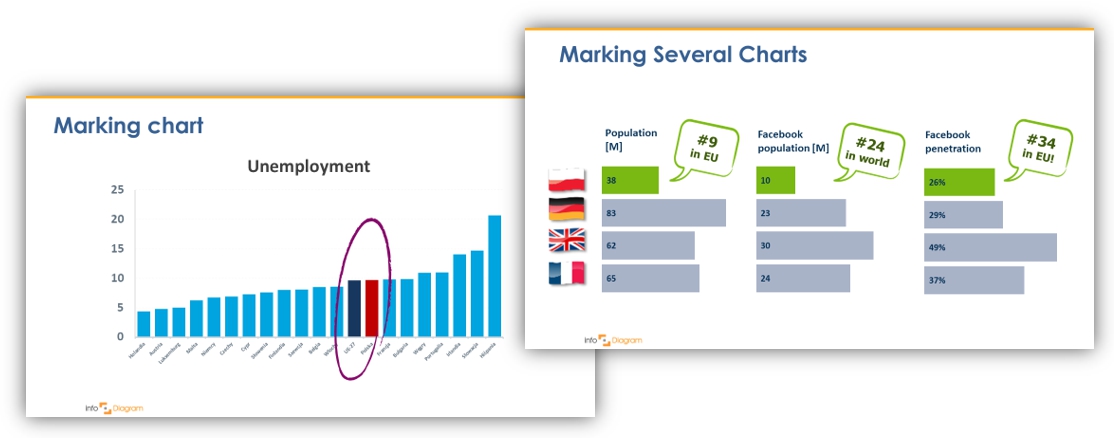
2. Add callouts and annotations to direct the eye
Another visually creative way to highlight a key data is using callout annotation. See examples below. They are nice unique addition.
If you presented the paper copy, I bet you’d use a marker pen and circle the main point. You can create a similar effect also on a slide. I suggest two ways:
- Use a standard circle shape with a color outline and transparent fill.
- Add sketch-like markers like our hand-drawn arrows to accentuate the most important part of the data you’re trying to show.
When not to use callouts? When the chart already has clear visual hierarchy. Over-annotation is itself a source of additional clutter.
This way you can quickly turn your chart coloring to solid, plain colors from your template and remove unnecessary axes. The result will be a more readable chart or table than the default one.
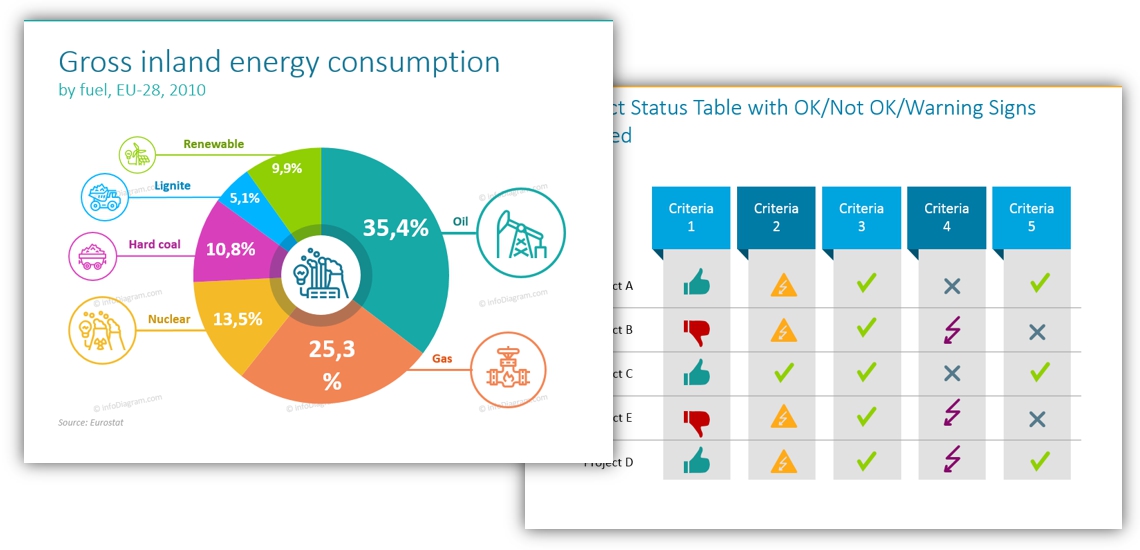
3. Make your charts more powerful by using icons
In addition to the basic steps for improving the impact of your chart, you can make a data visualization appealing by adding proper icons illustrating your chart items.
In McKinsey- and BCG-style decks, category icons aren’t decoration — they’re navigational shorthand. The reader sees the icon and knows the row before reading the label.
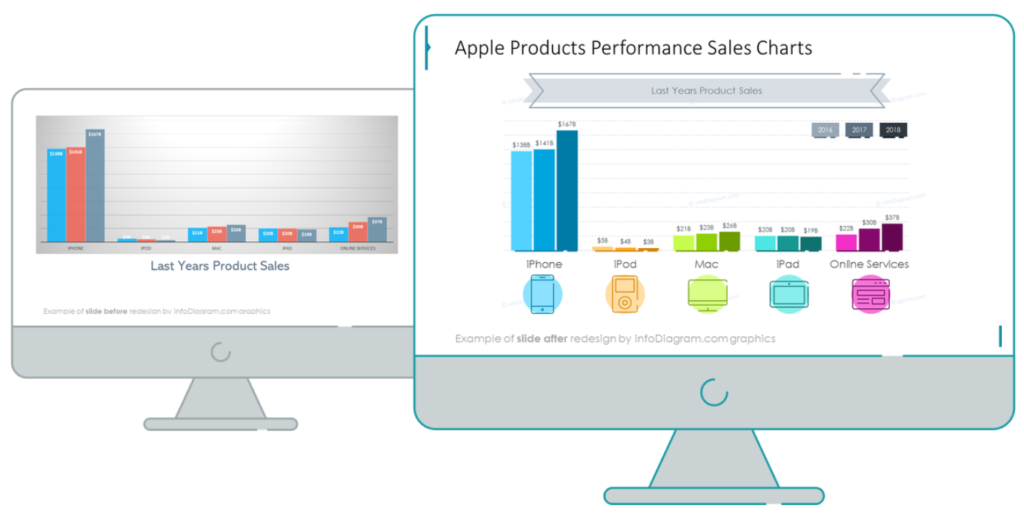
Data categories can easily be represented by intuitive graphics to create a visual association that is faster to process by our brain. Such data visualization will better serve your audience.
Where to find icons you can use for data illustration?
Firstly check if there’s an internal symbols collection your company prefers you to use, e.g. your marketing department can have such pictures set.
Depending on the topic of your data presentation, check those PowerPoint icon sets we have designed.
- Industry Sectors symbols: as flat industry PPT icon set or more delicate outline business sector PPT icons style
- IT sector PowerPoint Icons and Data Science PowerPoint Symbols
- General icons for infographics: simple flat symbols, outline icons, business concepts pictograms
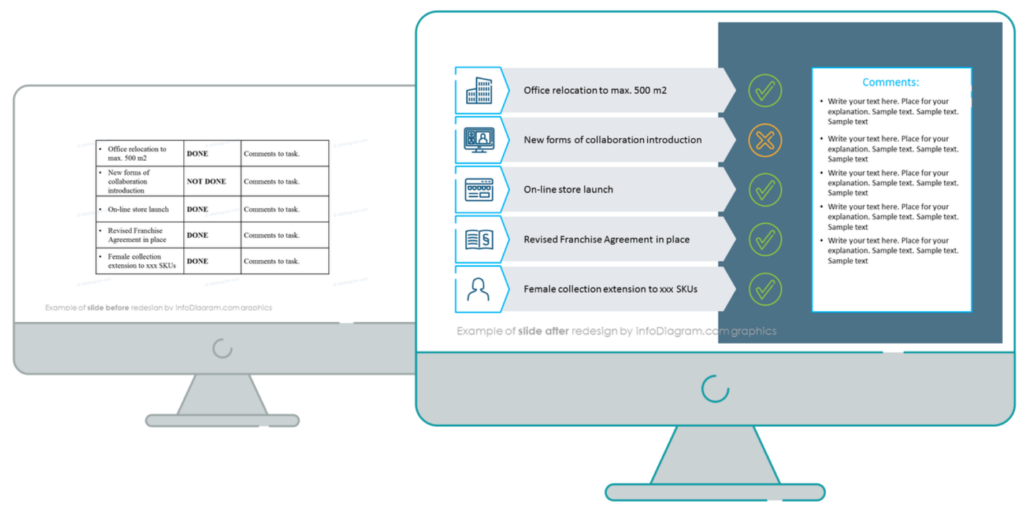
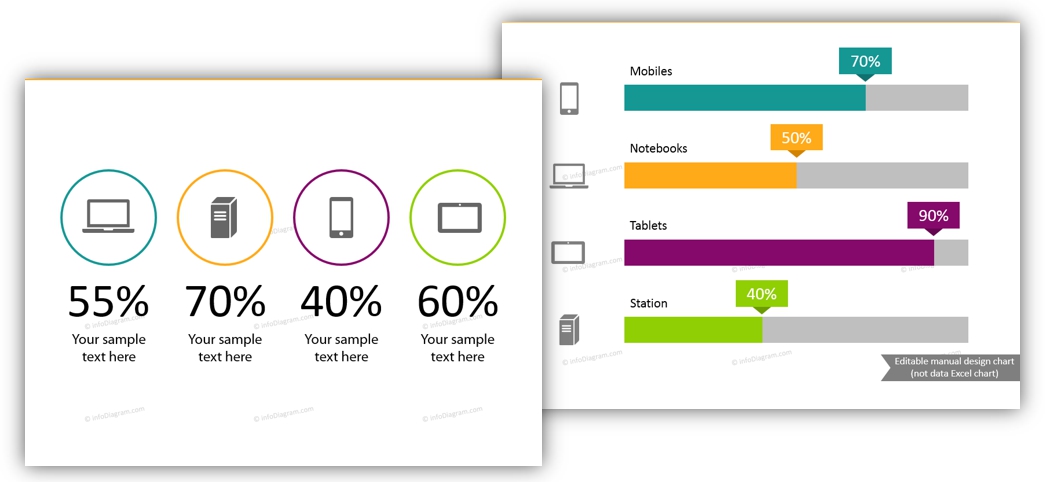
4. Show numbers and KPIs in creative ways
It’s not enough to simply have the information presented. Make the details stand out by presenting the data using simple infographic shapes. The graphics serve as placeholders for the numbers and details they might otherwise pass by. Highlight the crucial details and points you’d like to focus attention on your audience on.
Resources of creative charts
If you want to get inspired or use some untypical data chart shapes, check our collection of Excel editable charts for PowerPoint here.
Don’t lose the impact of your data visualization slides
By using these tips you’ll not only have more engaging presentations, but your information will be easier to understand and follow. Impress your audience as you educate during your next presentation!
For delivering data presentations, you should check videos of Hans Rosling – an amazing Swedish professor who was a master in presenting data in an amazing way. Definitely check his TED talks of Hans Rosling or his BBC presentation.
Remember, charts alone don’t persuade — they need a narrative. Read how in my other article: [Data Storytelling in Business Presentations]
If you get stuck at any point, contact me (best via my LinkedIn or contact page). I would be happy to provide suggestions and ideas to make your next concepts pop with intuitive illustrations.
Peter
infoDiagram co-founder, presentation design consultant