Demonstrate your Business Presence and Influence with Map Graphics
Express your company’s global reach with country map graphics
Global businesses need to be aware of their influence around the globe and be able to share that. This is necessary internally but also outside of the organization. Why might you need to provide this information?
To share details about places you or your company will hold meetings or attend conferences. Whether you want to provide logistical data or project attendance numbers, maps can provide a great deal of relevant content.
How can you use maps? Here are 4 PowerPoint slide examples
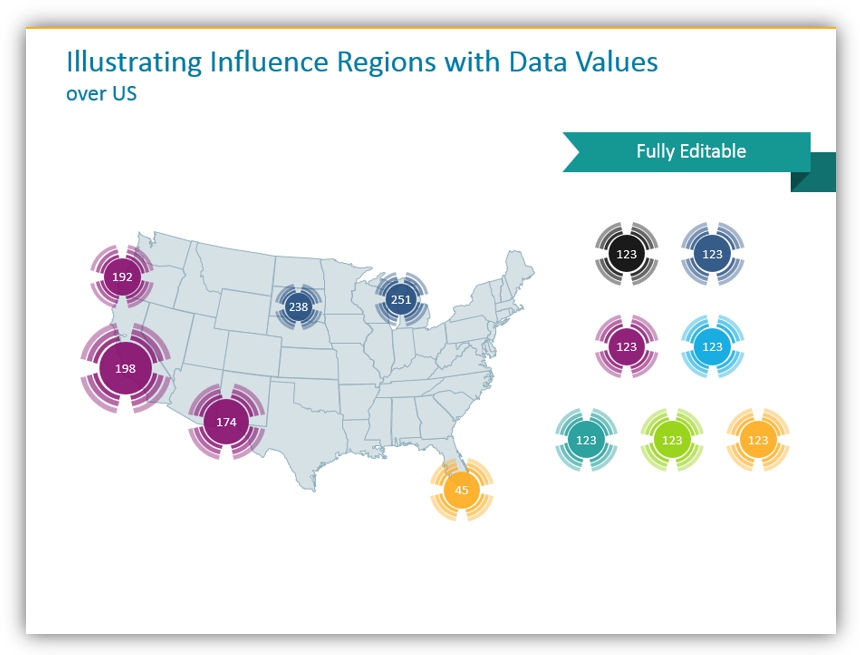
Illustrating an area of influence with radial circles
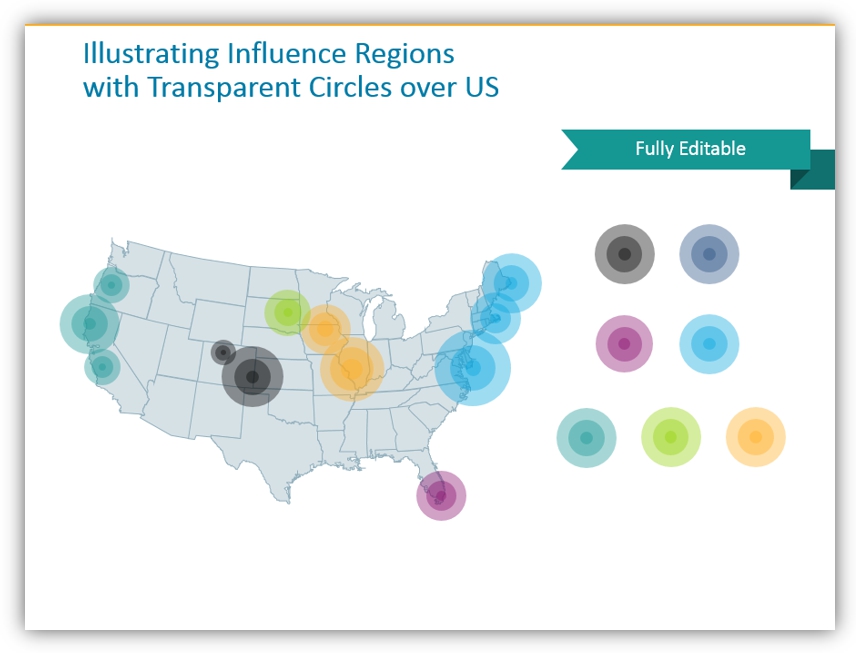
Using radial circles on a map is a good way to present reach from a specific point. This method is a suitable design technique for presentations if you need:
- to show the area influenced by a new shopping mall or business location,
- present the reach of sales reps. This will also help identify if there is an overlap of several representatives in a particular region
- how far your field technicians can travel from the local office.
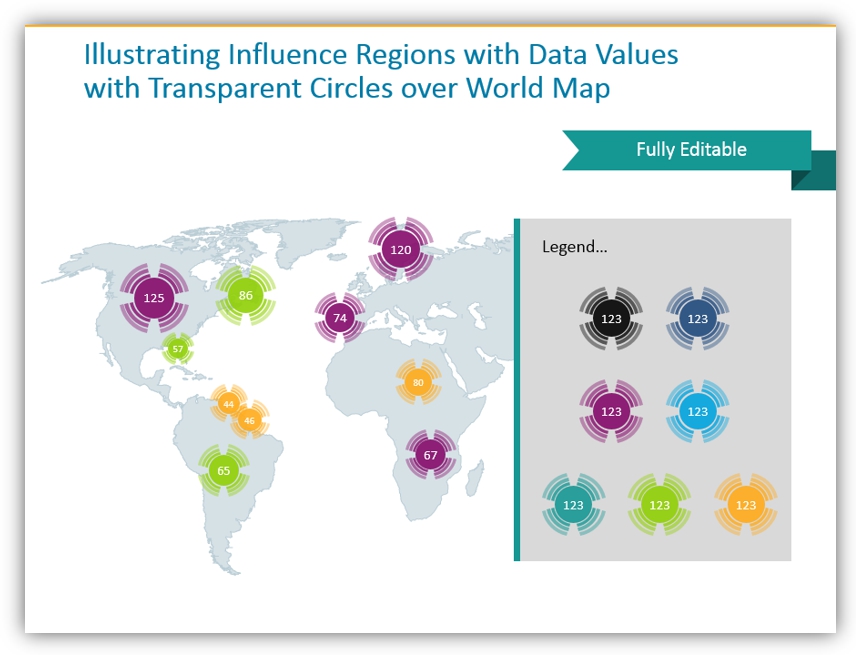
Of course, the circles represent a certain level of abstraction (they don’t consider road or plane routes). Therefore this design technique is good to express such regional reach on a general level rather than highlighting specific locations. For more specific needs we designed semitransparent circles you can place over a map. You can change their colors while keeping transparency intact. So even if 2 circles overlap, the influence regions over the map will still be visible.
Presenting clients’ or prospects’ locations on a map
You may share details about prospective clients/customers based on their location. This information could be useful for sales department presentations or for customer service topics and seminars.
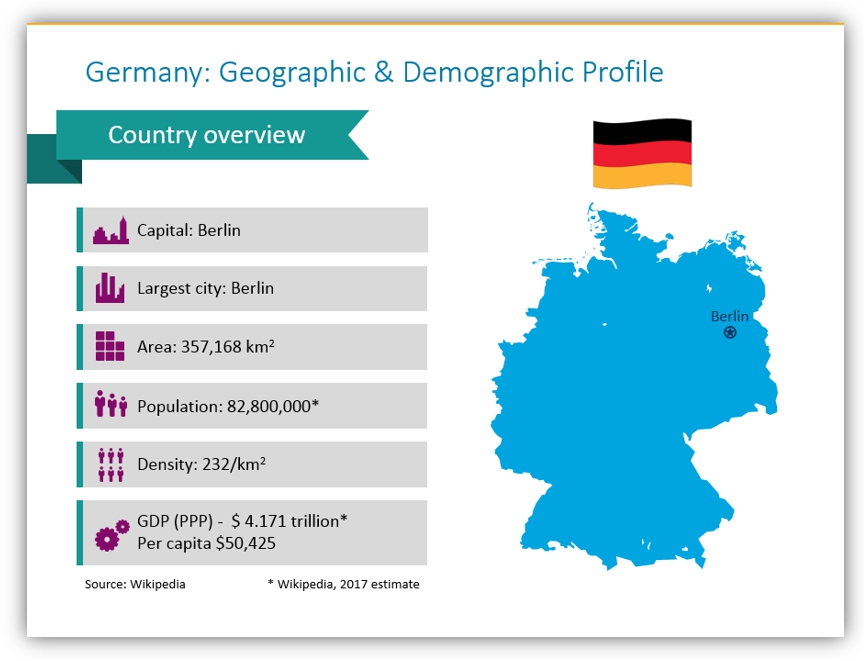
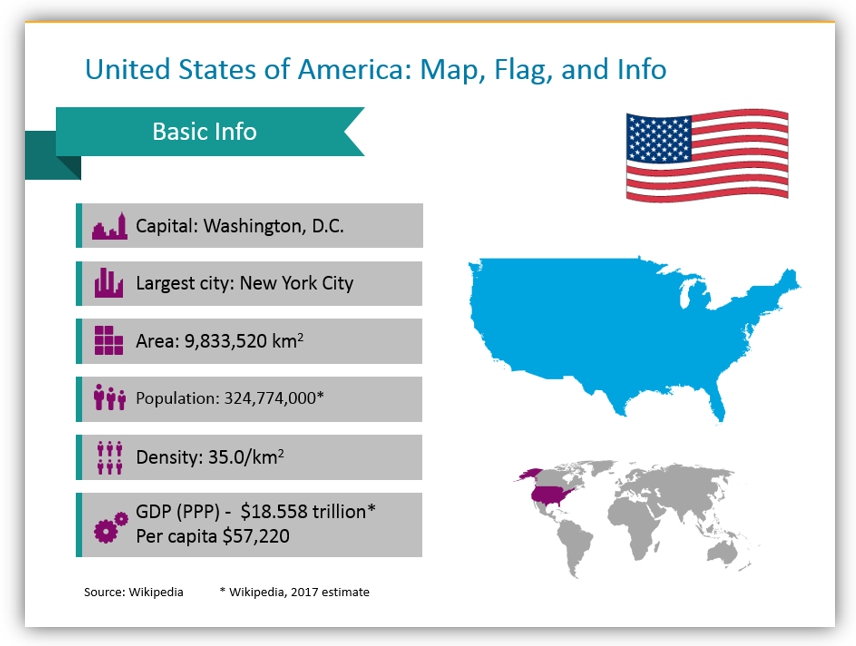
You may also break down geographic and demographic facts of the specific country your company is targeting. This will help your audience understand and visualize the regional business context data you’re trying to present.
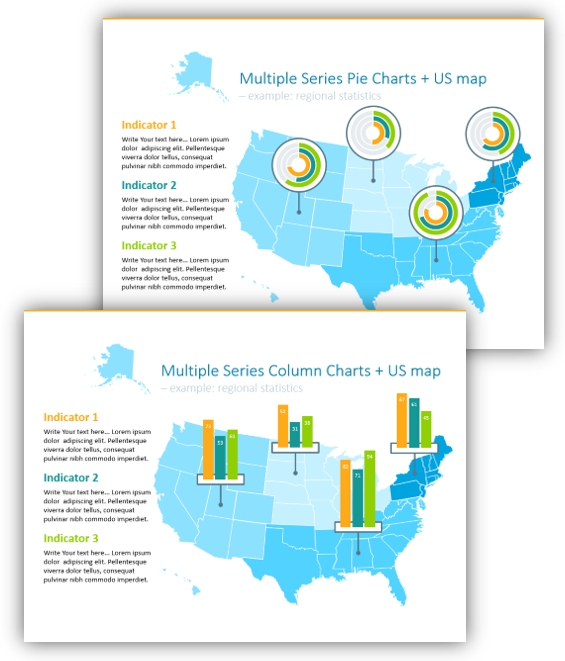
You can also use them to visualize various location-based data over a map. Product sales can be shared on maps of their geographic regions. Alternatively, you could share customer profiles in various cities or the market share in a specific state or region.
This requires adding a small, simple bar chart over a country map. We suggest keeping the data chart as simple as possible. Just show the main values. You don’t need to show detailed grids and axes values.
Here are more ways to use maps in PowerPoint presentations
You can use graphics to break down areas. You’ll also be able to highlight areas of influence. For example, owners of a new shopping mall may chart out its client reach area on a map.
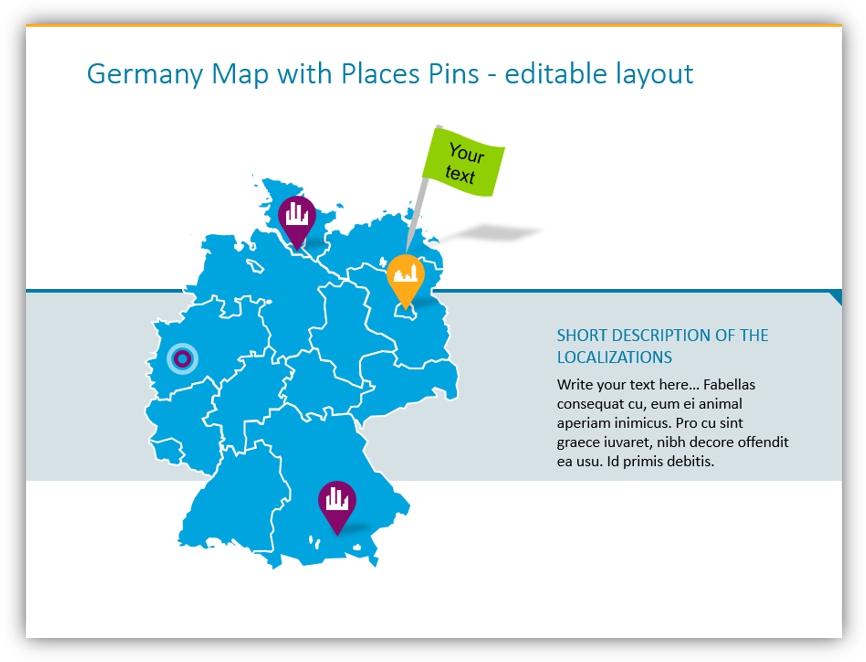
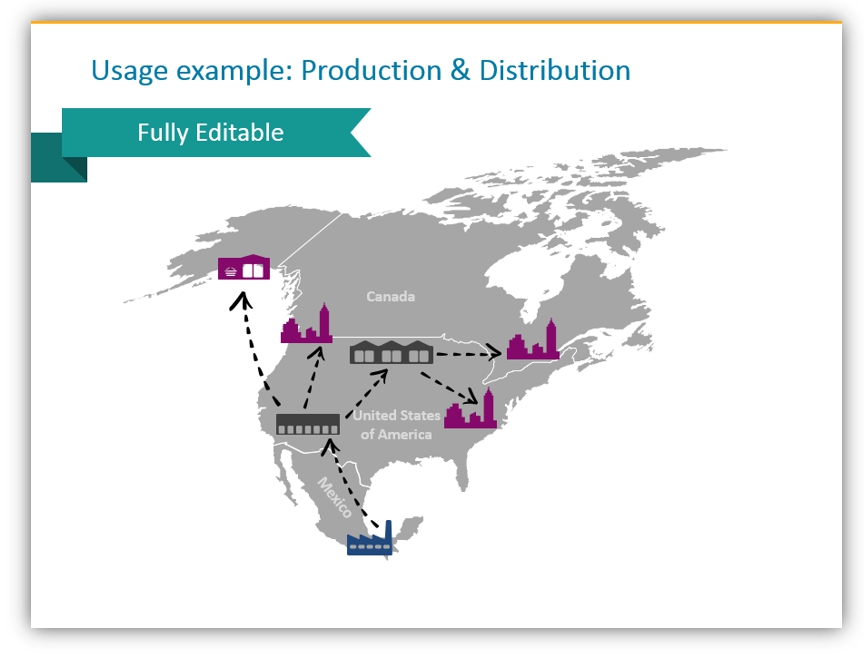
You can even show several different areas on the same map by putting pins or markers on the relevant areas. You could easily mark points of interest in this fashion. That could look like highlighting local factories, supply and distribution hubs, natural resource locations, shopping areas, or anything related to your business.
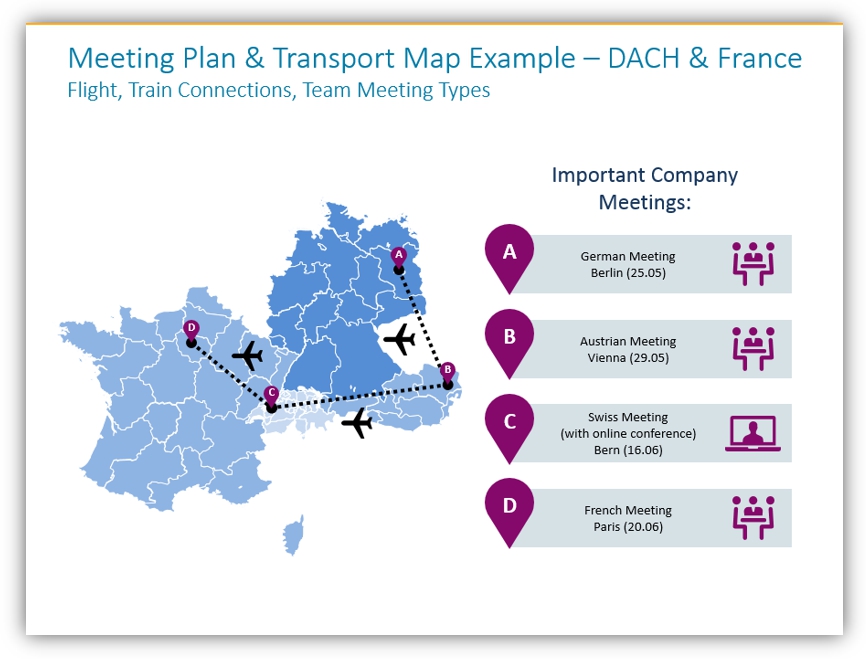
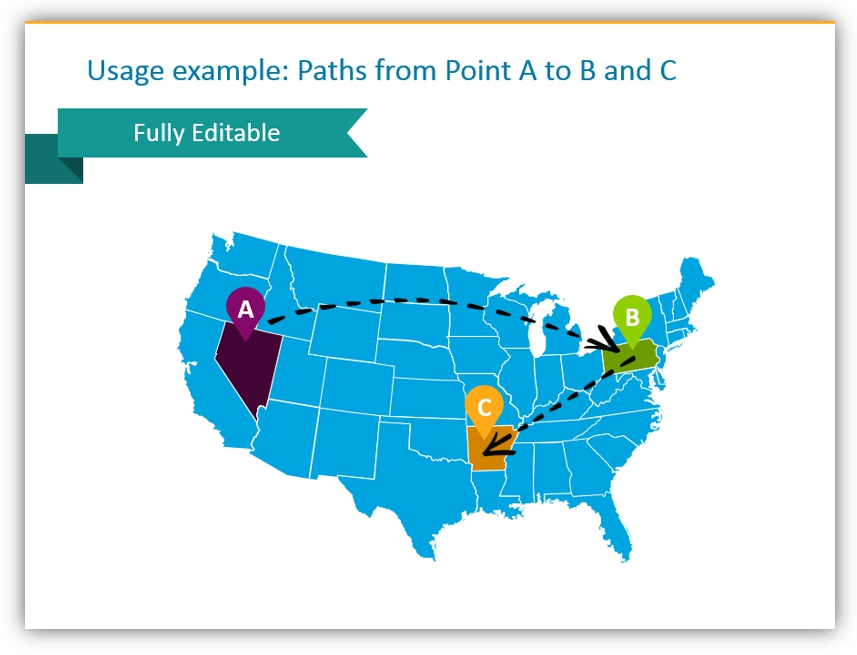
Plot all transportation needs
You can graphically represent different administrative and executive points on maps. You may also plot out delivery routes. Delivery routes or areas can easily be marked on maps whether you’re in a big logistics business like Amazon or a small, local pizza shop. If you aren’t always making deliveries or planning routes, map graphics can help you plot out one-off trips. Things like sales trips or local research locations are perfect for this.
Level up your map with extras
What’s great about using maps to visually represent different topics is how easily they can be embellished. The additional graphics included in our map set can help you immensely. We designed the set to help you make effective presentations. You notice how we used some of the extras in the above slide(s). The centric circles are semi-transparent so they can be placed over the map. That way the background will still display. You may design similar shapes yourself in PowerPoint – let our designs inspire you! If you want to save time and replicate these looks, get the ready-made map set.
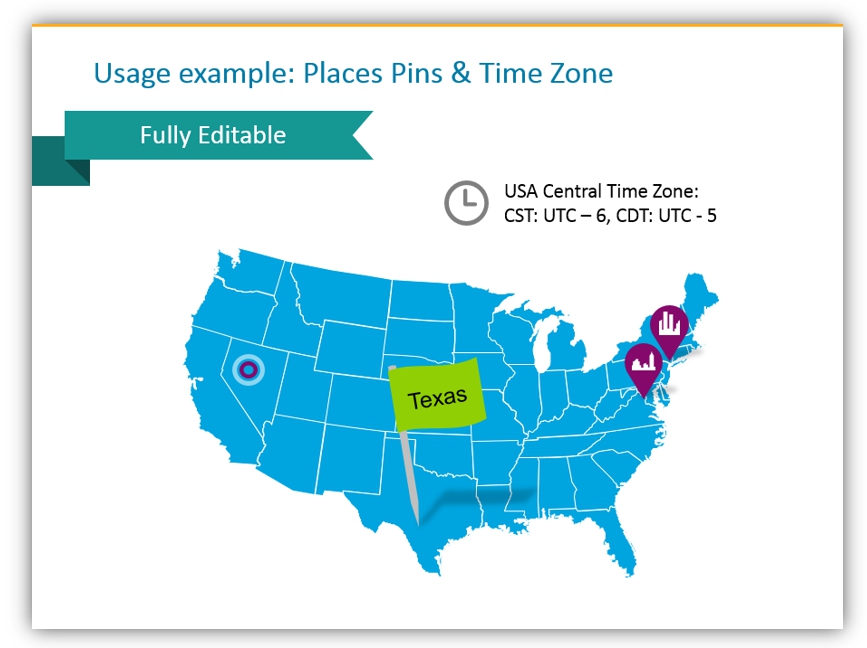
Flags, circles, triangles, squares, and other shapes can all be used to mark, highlight, and accentuate map graphics. They will help make your points. You can also utilize building and retail artwork to tell your story. Represent distribution centers on your map with a relevant graphic, not just a text label. Time zone information can be useful when dealing with regions that span multiple time zones (such as in the above example featuring the United States) or when discussing global business.
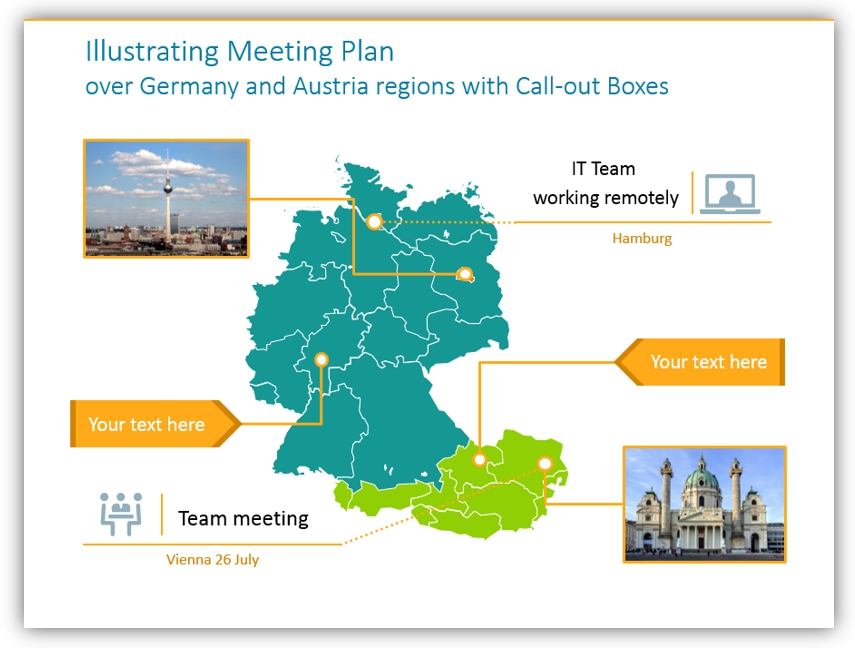
When text labels are necessary, as in the above example, you can brighten them up by utilizing different colors or adding images to the call-out boxes in addition to text. Using these call-out boxes you can easily highlight specific information or locations.
Need more ideas?
Additional shapes are available here. Utilize any of the images in the simple icon set to improve your presentations.


