Business Process Flow Chart Illustrated in PowerPoint [SmartArt slide makeover]
Presenting a business process or various information flow models in an organization are common topics whether you are from a corporate or small business world. If you are looking for an innovative way to illustrate a process or business model, you can find it here. Get inspired by our slide makeover example of the simple SmartArt flowchart.
The secret of Attractive Process Visualization: Alignment and Visual Symbols
People remember visual information better than heavy text. So using diagrams to show the processes and models is no doubt a better way to present them. However, in order for your diagram charts to look attractive and professional you should ensure two things in your slide visualization:
- Ensure the diagram is well readable, by having all shapes aligned with enough white space. See this blog “3 Diagram Mistakes to Avoid in Presentation Slides Design” for more examples.
- Make diagram elements easier to read and understand by creating a visual association to key process elements by adding pictogram symbols.
Here are some practical benefits of using symbols:
- the consistent visual style adds a professional look to your documents (of course, if you choose modern-looking neat graphics and not the default pictures).
- illustrating the specific key concepts by icons in your document with help your audience focus on important parts.
- the presentation or article will be easy to read, which means the audience will remember it better, than other presenters’.
Remark: You can download all the icons and diagrams from the Outline Business PPT Icons for infographics.
Also, check our ideas for expressing abstract concepts using icons.
Symbol Ideas for Business Processes & Models
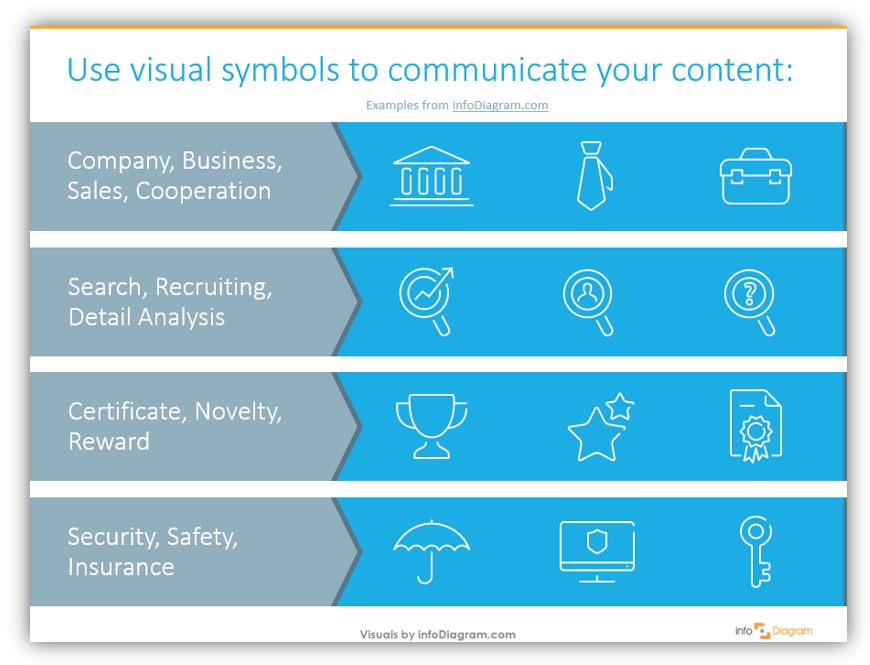
Finding a proper symbol for various abstract business concepts is not always an easy task. We’ve prepared an icon set that can help you to find and illustrate the most common topics. They are grouped into 8 groups:
- The company, Business, Sales, Cooperation: can be illustrated with a pillar building, a tie, or a classical suitcase
- Search, Recruiting, Detail Analysis: variations of a magnifying glass with a different meaning. You can easily change the icon inside to suit your content
- Certificate, Novelty, Reward: winner’s cup, starts, or certification document
- Security, Safety, Insurance: safe umbrella, a key, or a monitor with a shield will work. Surely you can use the separate icon of a shield, just make it bigger.
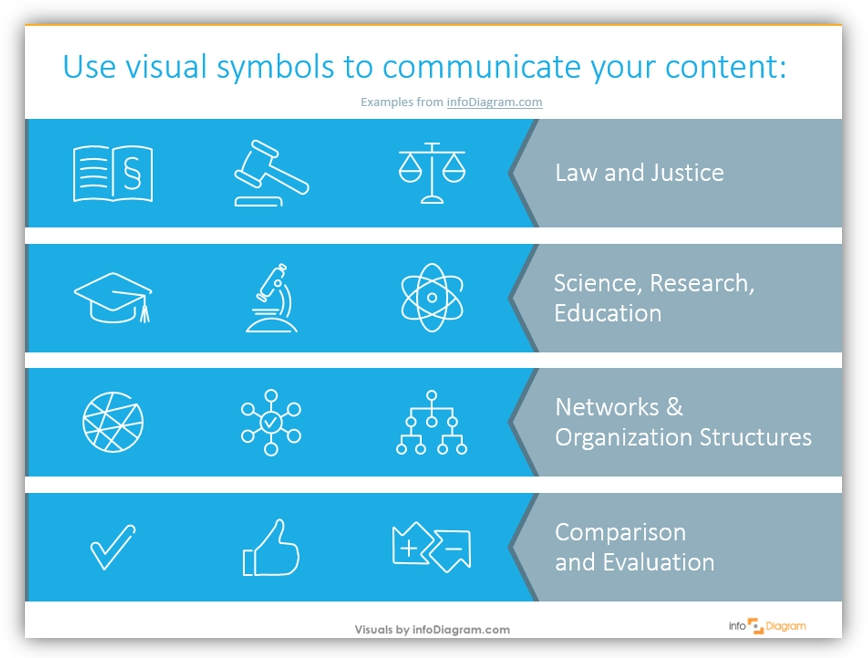
- Law and Justice: scales, book with a law symbol or a judge’s hammer
- Science, Research, Education: graduation hat, microscope, or an icon of an atom will help you to show any of those concepts
- Networks & Organization Structures: various representations of a group network: hierarchical, central, or shown in a circle with a lot of connections
- Comparison and Evaluation: thumbs up, tick symbol, or arrows with the opposite signs
See several design ways how you can blend symbols with your content, to make your presentation look professional.
How We Redesigned Business Process Slide
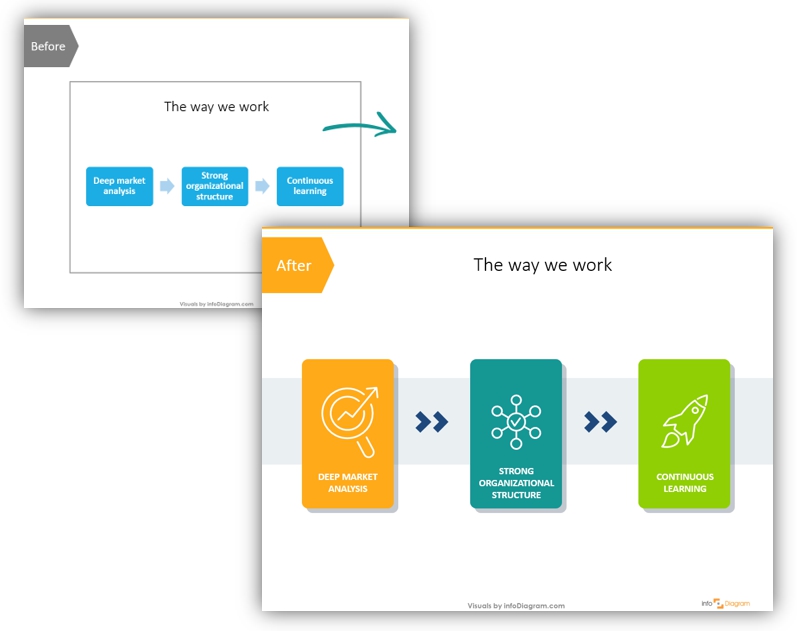
Let’s see how we can apply icons to make creative diagrams. We decided to go with a simple example of the business process or values of the particular company.
The first step is usually using the PowerPoint SmartArt tool to create one of the diagram types. Here is an example of using a simple 3-step horizontal flowchart, but any other chart can be redesigned following our example.
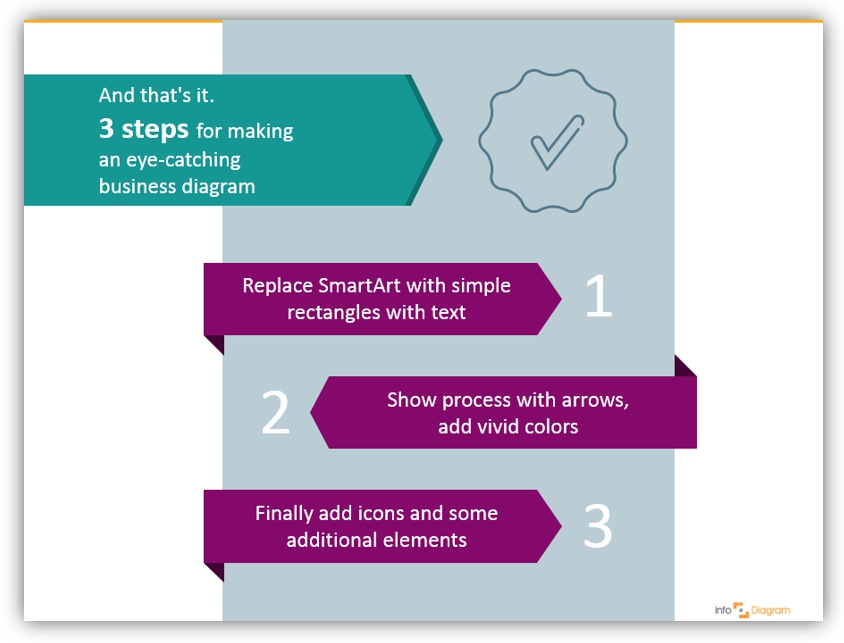
Three steps for making a professional-looking business diagram (using the symbols mentioned above):
1. Replace SmartArt with simple shapes
Default SmartArt looks like default SmartArt. The standard shape proportions, standard looking arrows. Well, it’s better than bullet-point text, but far from nice professional graphics.
That’s why we suggest replacing the SmartArt chart with a set of shapes with some additional design moves, such as atypical arrows and proportions of diagram elements.
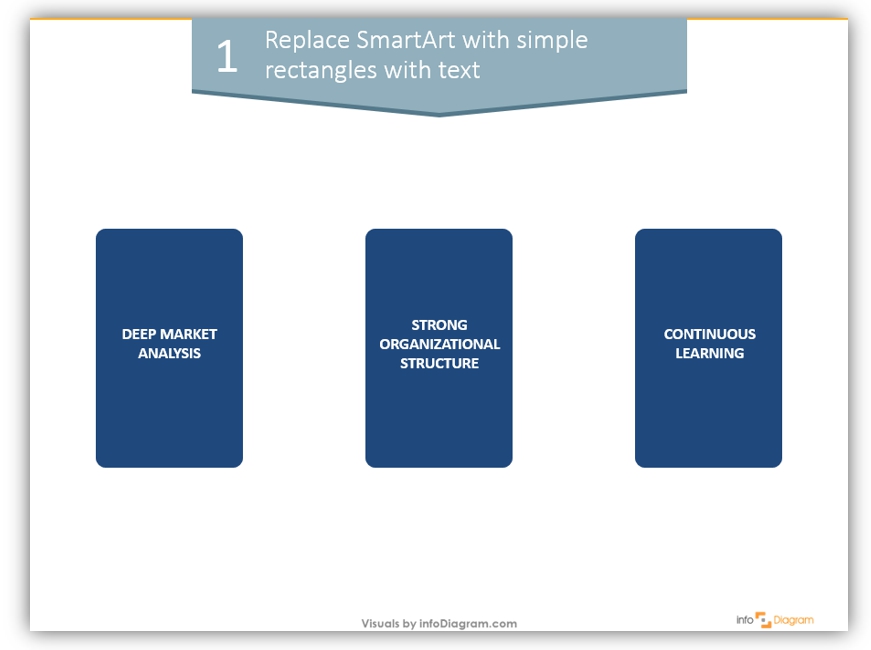
We decided to go with large rectangles – as we have enough space on a slide, so we can make shapes bigger and have enough white space inside the shape too. Remember about proper alignment – equal distances between shapes and slide margins.
2. Show process with atypical arrows
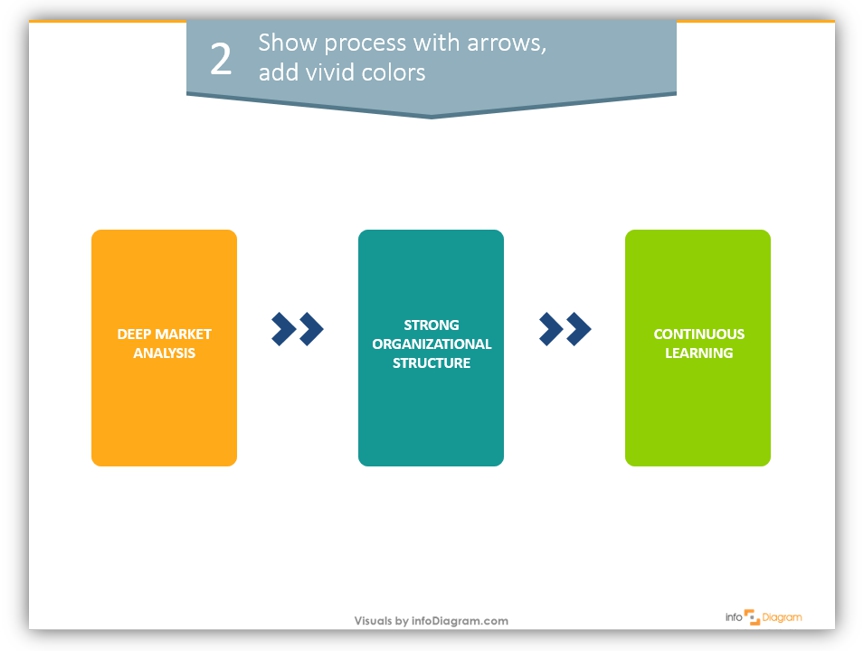
Our diagram is supposed to show a continuous process, and arrows are a proven design element to show it. We chose double simple arrows, which contrast with the colors of rectangles.
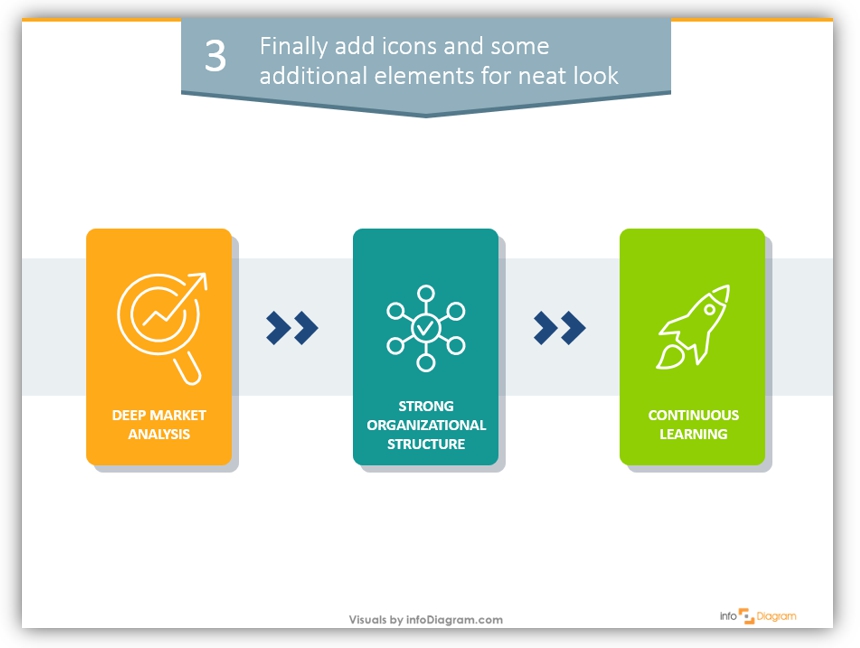
3. Add icons and some additional design elements
If you aim for a neat and professional look, try to add something more, than a color. Icons, shadows, thin lines, and barely visible backgrounds to choose from. Here’s our final version of the business process diagram. Note that it’s also important to have a balance and not overdo it with various elements on a slide.
How to change the text to an attractive diagram
In just three simple steps we designed a creative neat chart. As you see, there’s nothing impossible, even if you’re not a designer.
You just need some practice. In the same way, you can show various business models and company processes.
Get inspired and experiment with your slides!
Graphics and Reading Resources
- Abstract concepts visualization ideas: Business concepts visualization list for better PowerPoint slides
- Article about improving data chart presentation slide
If you like the symbols and example diagram above, you can get the icons collection we used (or subscribe and download slides every month):
Should you need help with choosing or using our PowerPoint graphics, let us know here. We will gladly help.


