Use Creative Data Table Template for PowerPoint to Save Time
When making data-heavy presentations or sharing dense information, you may wish to use a data table template. Tables are wonderful for helping you keep the information you need to present organized and easy for your audience to follow. However, creating a neat-looking and readable table can be pretty time-consuming. What if you could simply select a ready-made table, customize its content, add your brand colors, and move to the next slide?
For presenting financial data, check our blog 10 slide ideas for creating structured and professional financial slides using PowerPoint tools.
This timesaver data table template deck was designed to save you time, energy, and effort. Rather than building each table, you have 12 table designs to choose from with various graphical elements to help you customize each one. You’re free to modify the colors, size, line thickness, and icon symbols to ensure the slide looks exactly as you’d like it to.
Disclaimer: The table templates we present here come from the commercial Tables Graphics Presentation Timesaver that we’ve designed.
Let me share several design ideas on how to make a presentation table cleaner and more eye-catchy:
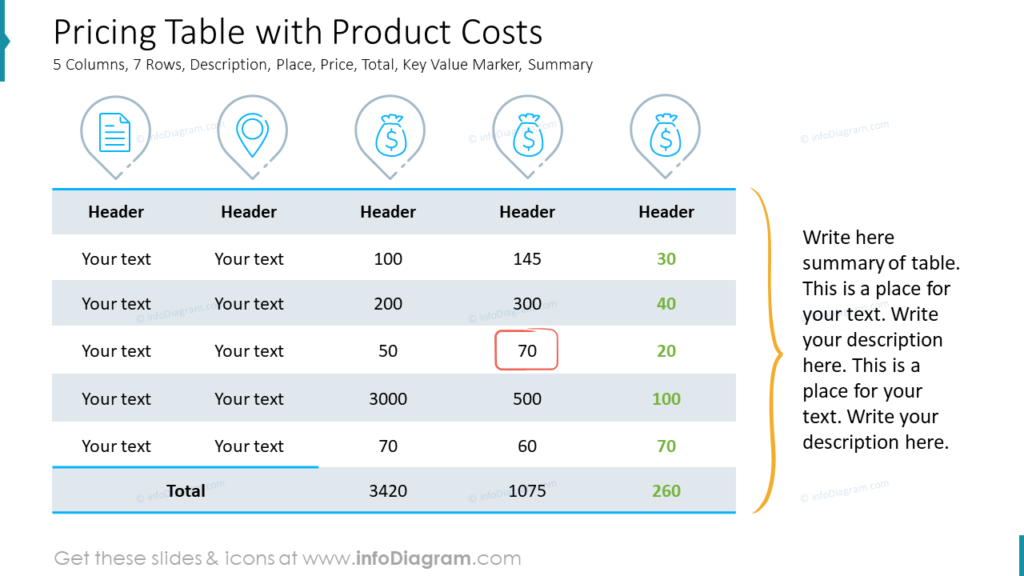
Ensure There is Enough Margin
Check if there’s enough space inside the cells, so the table is easy to read. Set it in PowerPoint: Table tab: Layout: Cell Margins. Choose at least Narrow.
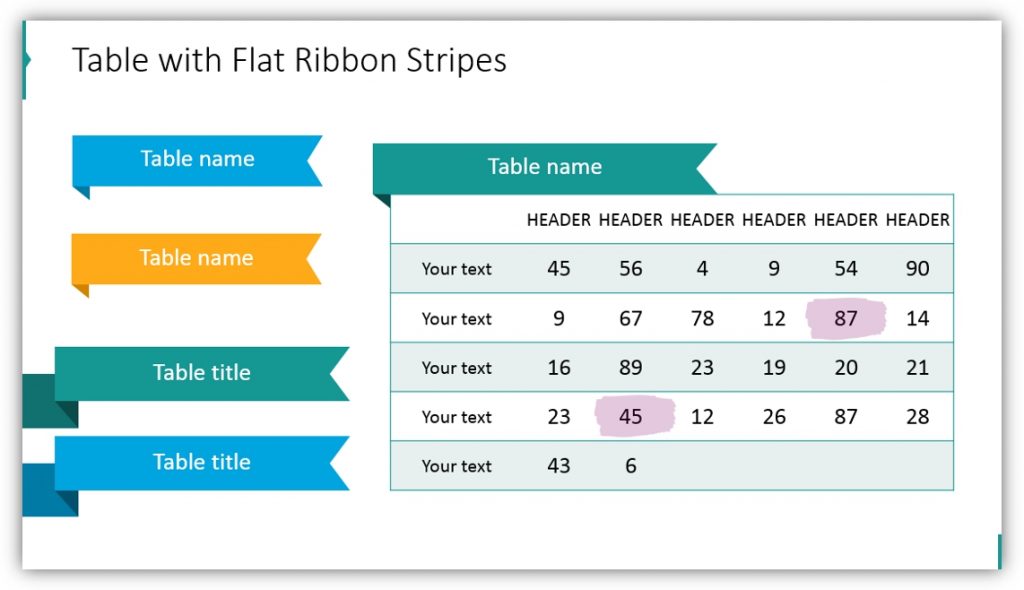
Make Your Tables Creative With Custom Header Graphics
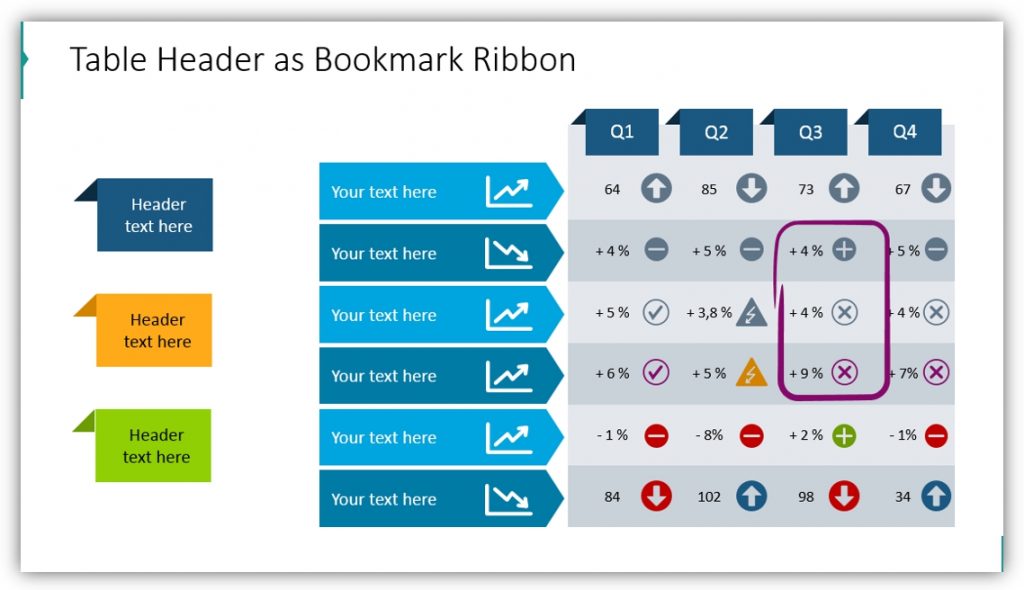
Table headers can be fun and creative, especially if you choose to use the handwritten style. The Timesaving Creative Table Graphics set can be customized with flat arrow stripes, or with bookmark ribbons. You can customize the table by changing the colors, adding text, resizing them, or adding additional supplementary icons. Notice how, in addition to custom headers, the table has certain data in Q3 circled. You can use similar graphics to highlight any significant data in your table.
Highlight Significant Data, Your Notes, or Other Important Information
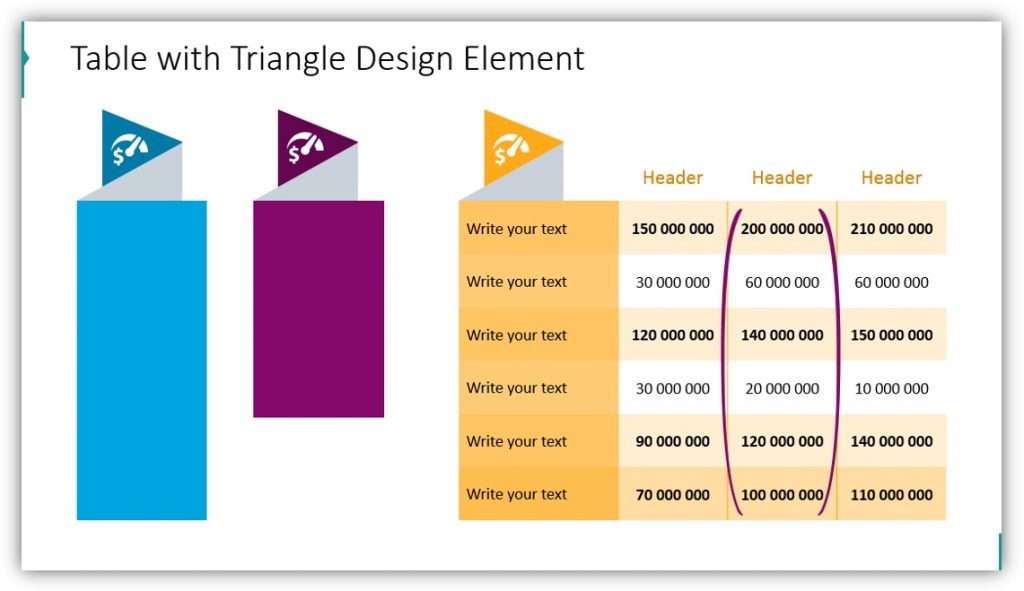
When you utilize the timesaving triangle design element tables you can single out important information or clearly mark your comments. In the above example, the headers for the table columns are simple text, but the details in the first column are easy to spot thanks to the bold triangle design element. If you have multiple types or categories of information to share you can customize and add as many triangle design elements as you wish.
Utilize Different Shapes to Keep It Creative
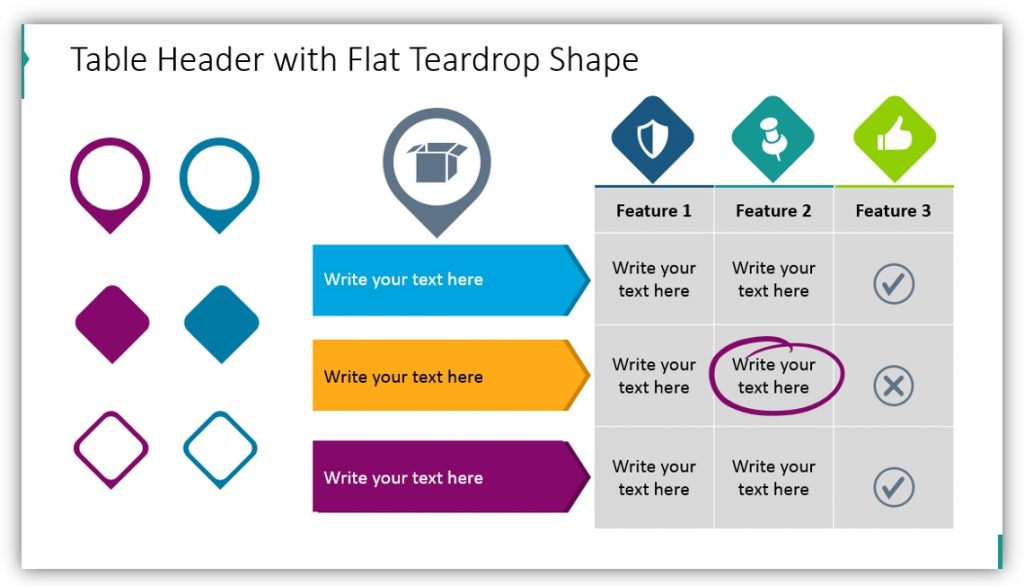
Table headers don’t need to utilize text to be effective. Notice how this example utilizes a teardrop shape as a table header, but rather than use a text description it makes use of a cardboard box icon. The diamond-shaped table headers use a similar strategy. By reducing the amount of text on the slide, you’re helping keep your audience focused and prevent overwhelm.
Use Arrow Stripes to Mark Your Rows
Headers aren’t the only parts of your table that can be customized. Your row labels can be tailored to stand out. Important row labels should catch the eye of your audience. Match your brand colors or make the colors significant to the material you are presenting. The choice is yours!
Creative Application of Calendar Tables
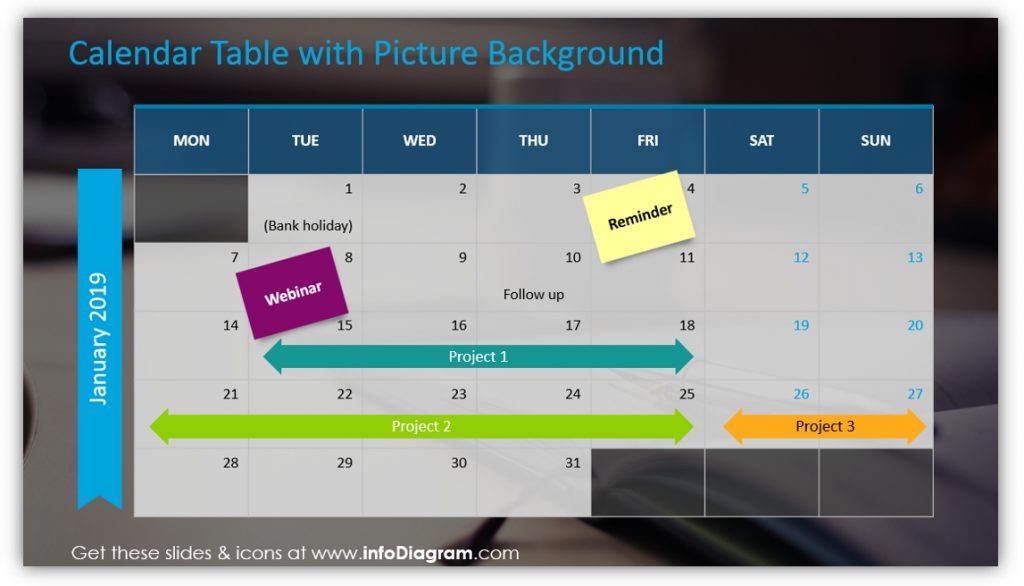
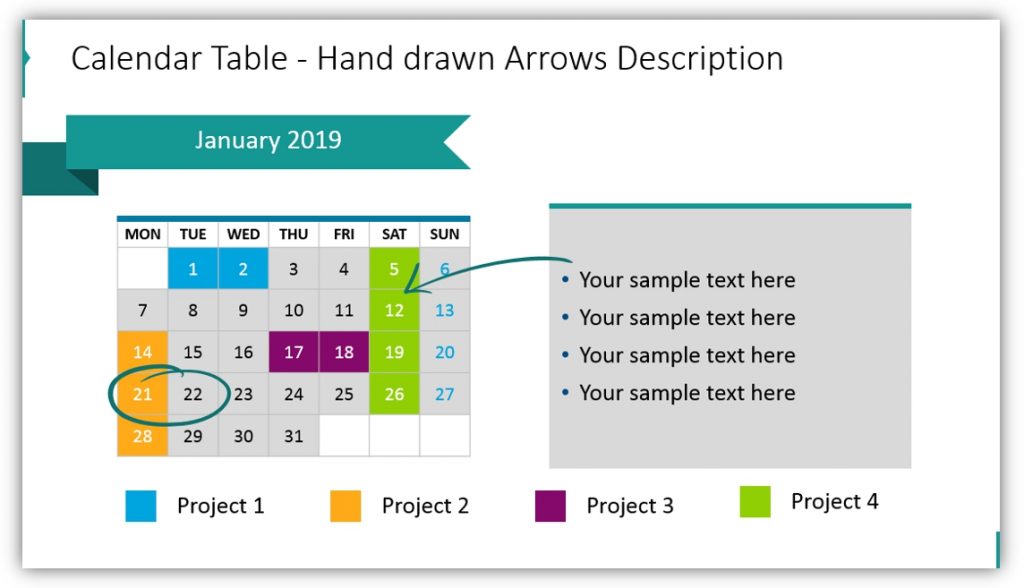
If your presentations feature deadlines, project timelines, dates, appointments, holidays, or other special days you’ll find plenty of uses for the calendar table! If you have multiple projects or teams which need to have visible deadlines or timelines, a calendar is an easy way to display that information. It’s easy to understand, and this slide deck is easy to use. You can find more monthly and yearly PowerPoint calendar tables here.
Whether you’re sharing statistics, financial figures, dates and times, or other detailed information tables can help you present the information in a way your audience will understand. By using this timesaving, creative data table template you can focus on relaying the essential information correctly and choosing a slide style that is right for you.
For more inspiration, subscribe to our YouTube channel:
Resource: Presentation Timesaver: Tables Graphics
Save time and make better presentations by using table graphics. Decide whether the creative, hand-drawn icons, watercolor sets, or modern graphics make the most sense for your audience. You can vary your selections based on the material covered, who your audience is, or what makes the most sense based on your brand. The important thing is you won’t need to create each slide from scratch.
If you find the above examples useful or helpful you can down the full table set here:
You can also download 200+ creative PowerPoint diagrams, including timelines, lists,


