Financial Report Presentation: 10 Slide Ideas for PowerPoint
Create a professional financial report presentation in PowerPoint. See 10 slide ideas for income statements, balance sheets, P&L, and performance dashboards.
Working on a company financial report, and want to make it different this time? Financial reviews are typically difficult to digest by non-financial audiences. It can be challenging to communicate the meaning behind the figures. If you want to disclose your quarterly or annual numbers in a simple and understandable way to your key stakeholders, check our blog for examples and inspiration.
A financial report is a management tool used to communicate key financial information to both internal and external stakeholders by covering aspects of financial affairs with the help of KPIs, such as income statements, balance sheets, cash flow, or financial ratios analysis. See how to prepare structured and professional financial slides smoothly using PowerPoint tools.
All graphics examples presented below can be downloaded as an editable source. Explore the Financial Report and Performance Indicators Presentation for PowerPoint.
Get inspired by seven examples of how you can illustrate the components of your financial report presentation and a quick instruction on how you can create a P&L Statement table using simple design tricks.
Visualize your key financial indicators
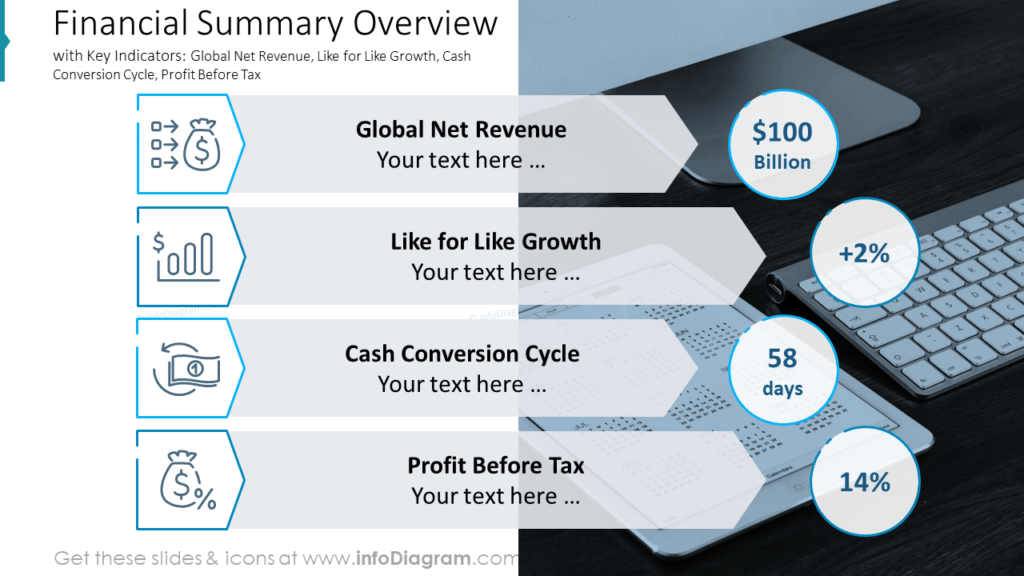
Such a general slide with a financial report presentation summary will help to analyze the big picture and ensure you’re on the same page with the audience.
You can list the common key indicators such as Global Net Revenue, Like for Like Growth, Cash Conversion Cycle, and Profit Before Tax. A neutral background picture makes the slide more attractive and circles with highlights on the right help to stay focused on important numbers.
Show revenue and profit snapshots on one dashboard slide
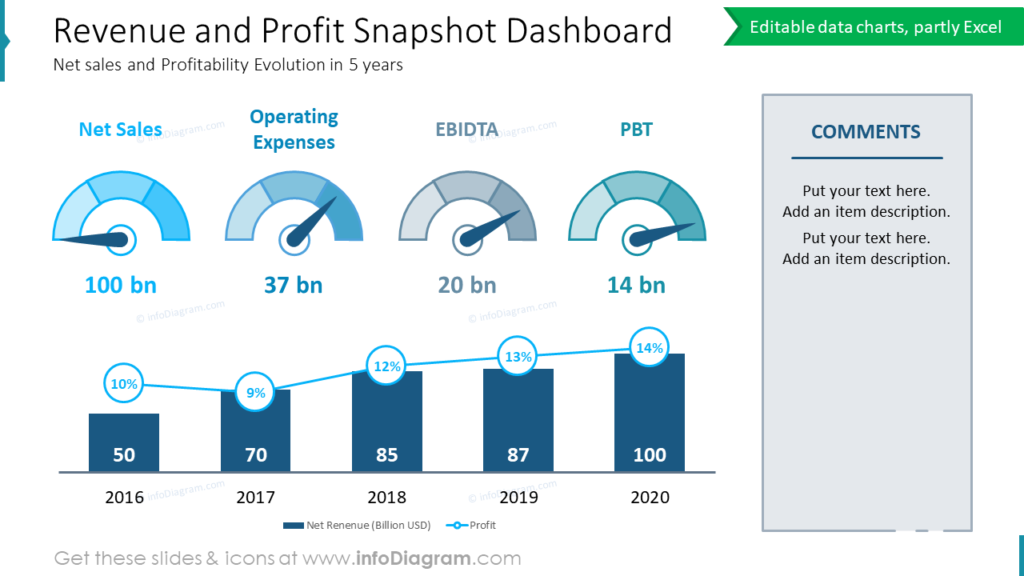
This slide shows how you can summarize net sales and profitability evolution using gauges and a simple bar chart. The dashboard illustrates typical profitability measures: Net Sales, Operating Expenses, EBIDTA, and PBT as easy-to-read gauge charts. The profit growth over the years is shown as a clear bar chart.
For more executive-level dashboard layouts with charts and KPIs, check the Executive Dashboard Layouts template – it includes ready-made dashboard grids you can fill with your own financial data.
Illustrate revenue highlights with clear charts
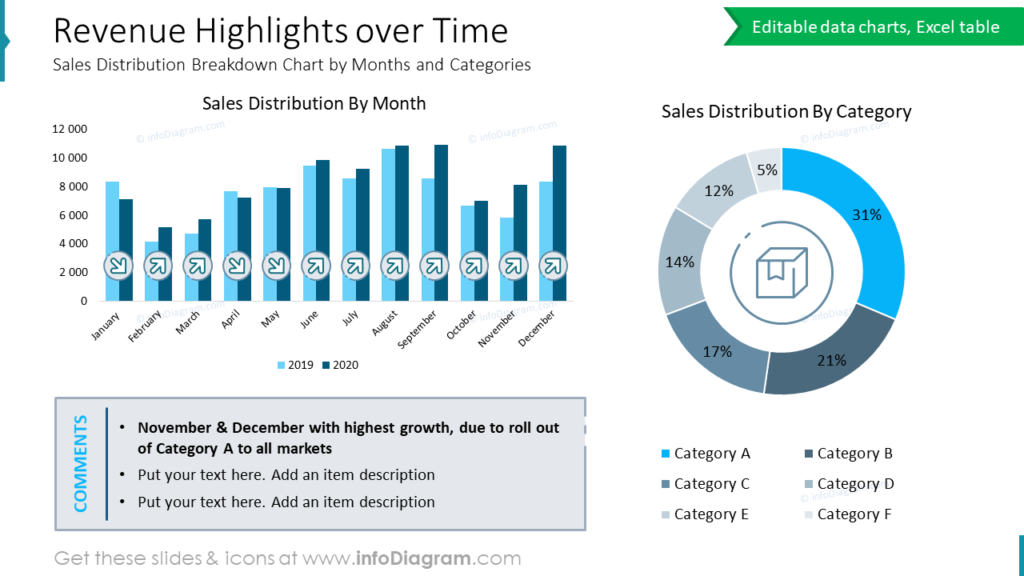
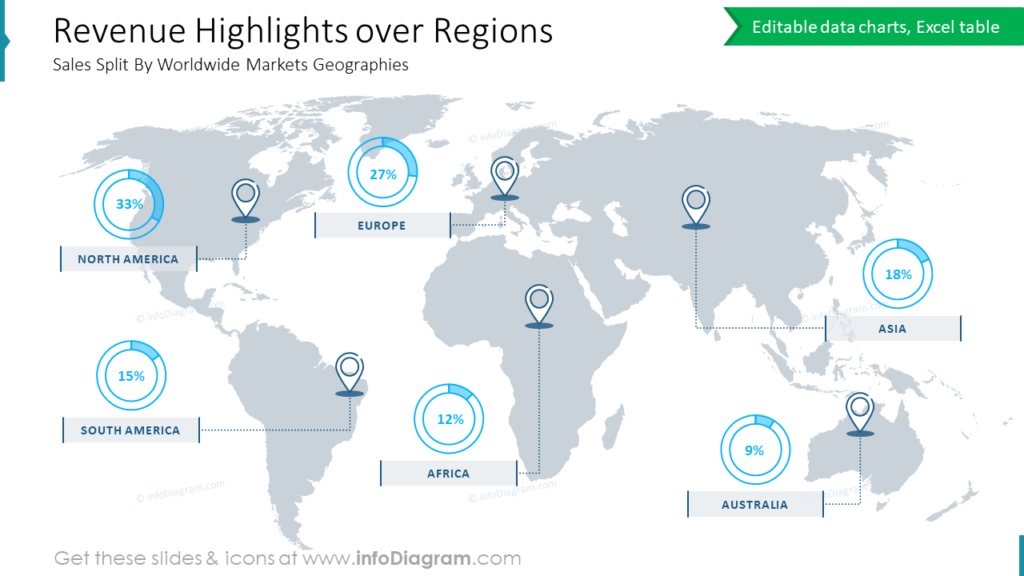
If you’d like to include additional data, for example, revenue highlights over time or regions, you can do it as on the slides above. The first one presents a sales distribution breakdown by months and categories. The second slide example presents sales split by worldwide market geographies on a world map as a light background underlining the location of the markets.
Small elements, like pin icons, doughnut charts, and color-coding will help you add a professional look to your presentation.
Pro tip: To help non-financial people digest the data, keep your slides short, don’t stuff them with jargon words. Use illustrations, and make the most essential data points clearly visible.
Include balance sheet and cash flow tables
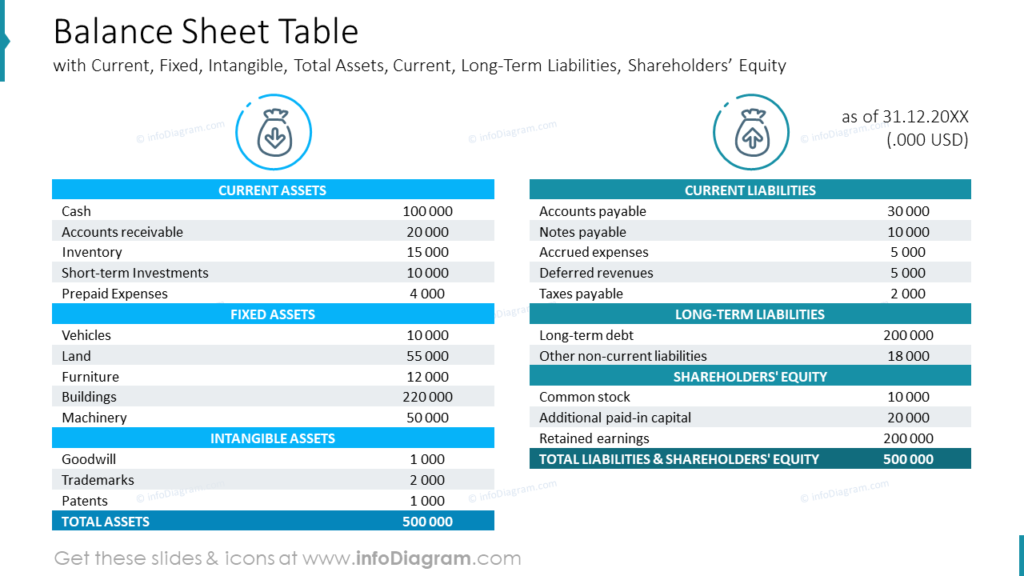
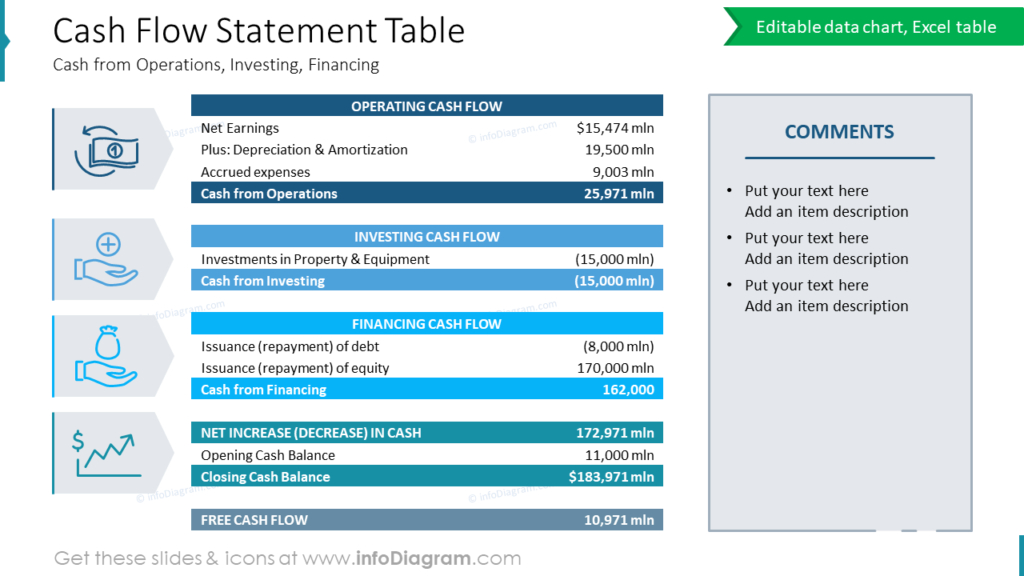
The very common problem is the unreadability of massive tables. The balance sheet and cash flow statement will be definitely complex, as you need to squeeze many numbers inside.
Notice how color-coding is used for various table sections, and illustrative symbols, which don’t steal attention from the content, but rather nicely add up. A text box aside can be used for your comments or notes.
Compare key drivers of revenue growth
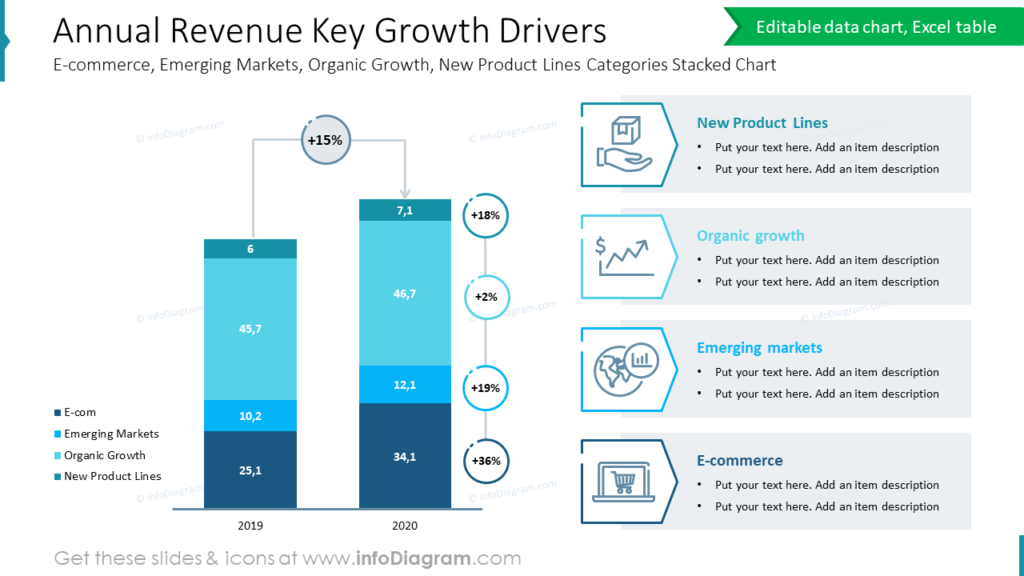
To illustrate the comparison of several growth drivers, you can apply such stacked bars.
Notice how specific drivers (E-commerce, Emerging Markets, Organic Growth, New Product Lines) are illustrated by corresponding icon symbols, all in one consistent style.
Visualize revenue analysis for each quarter in your financial report
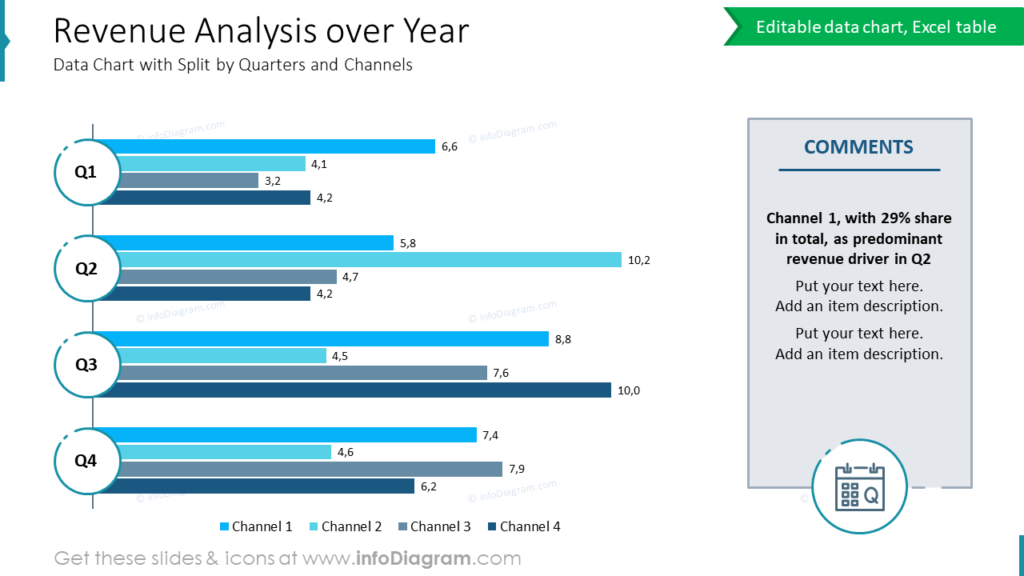
To present an analysis of sales revenue over the year, you can use such a bar chart. It’s slightly enhanced by adding quarter signs over the data chart.
This data chart illustrates revenue analysis split by quarters and channels. If you have some comments or notes you’d like to discuss, we advise putting the most essential point in bold.
Present your financial metrics and indicators as a dashboard grid
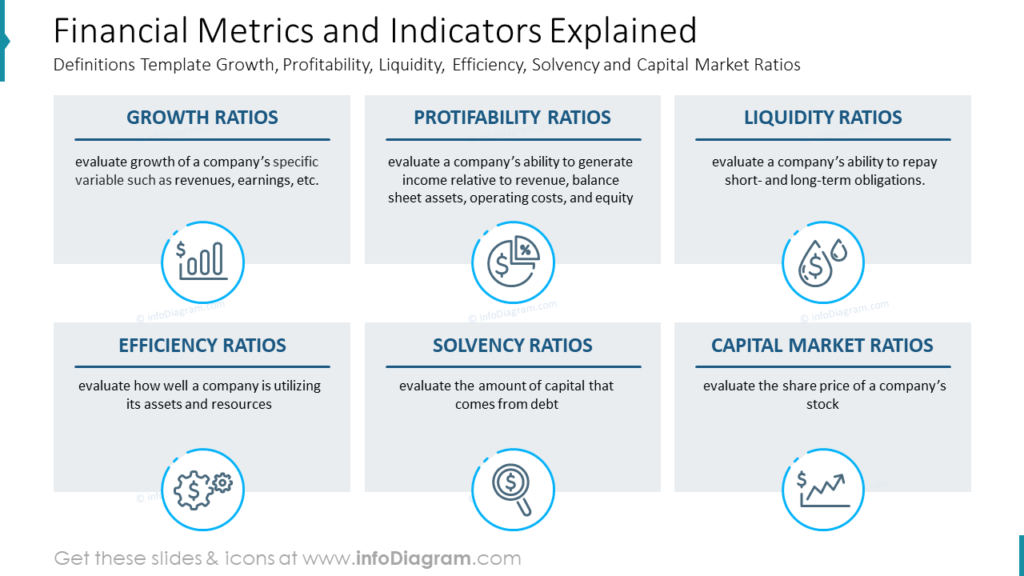
Want to go deeper and include the analysis of some ratios? A good idea is to firstly remind your audience what are those indicators and what exactly they show.
If you have more items to show on one slide, it’s good to organize them into some regular grid. Make sure all elements are aligned to make it look professional.
If you have more items to show on one slide, it’s good to organize them to some regular grid.
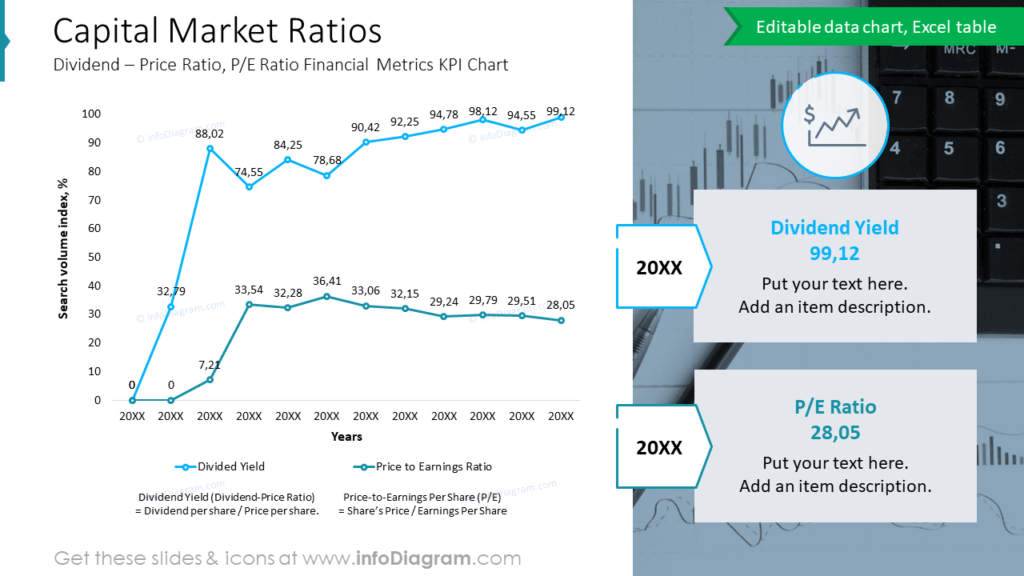
You can include general definitions and development of key financial analysis ratios e.g. growth, profitability, liquidity, efficiency, solvency, and capital market ratios. On the slide example, you can see the capital market ratios KPI line chart which shows the Dividend Yield and P/E Ratio change over the years.
Guide on how to redesign P&L Statement to a stylish table
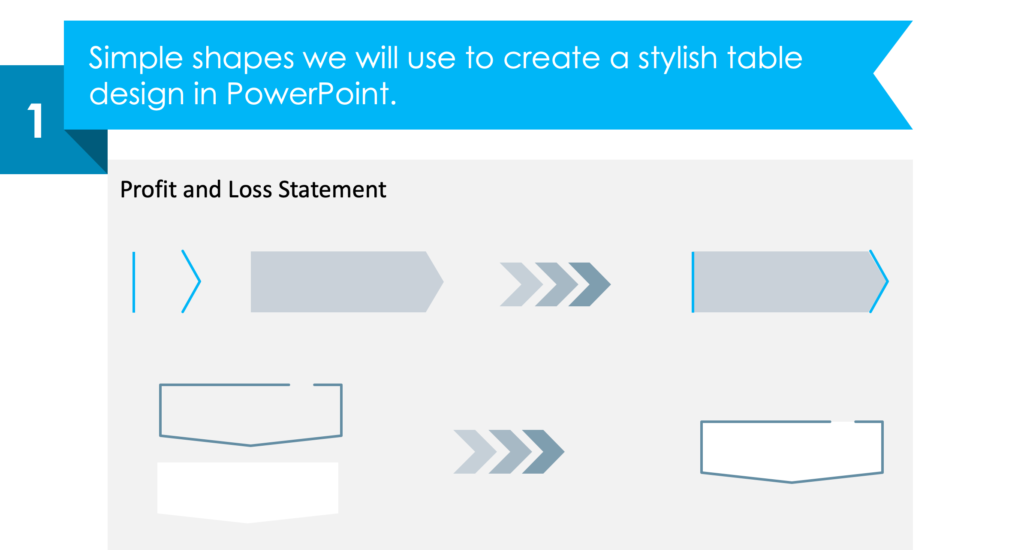
Here’s a step-by-step guide on how you can create a P&L Statement table using simple shapes, icons, and a few tricks that will save you time.
1. Use simple PowerPoint shapes to create a stylish table design.
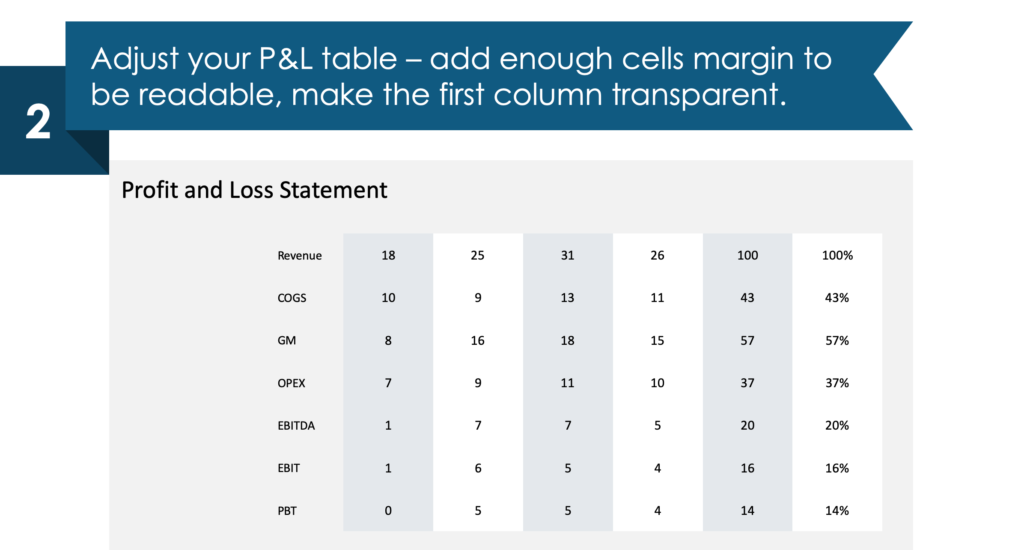
2. Adjust your source P&L table to be readable.
The trick is to have enough margin inside the table cell.
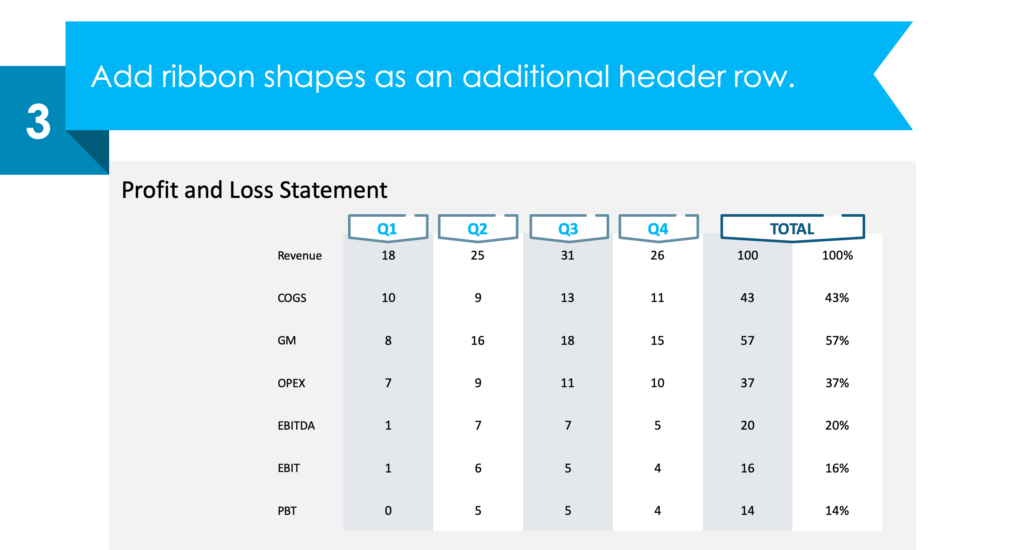
3. Enhance the table header
Add ribbon shapes as an additional header row to make the table look nicer.
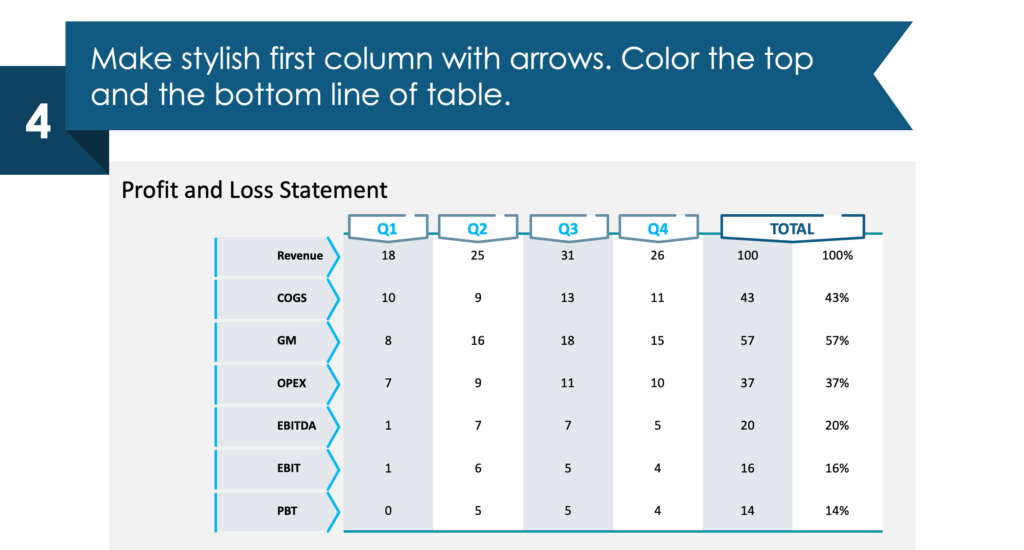
4. Redesign the first column
You can add stylish arrows in a place of 1st table column.
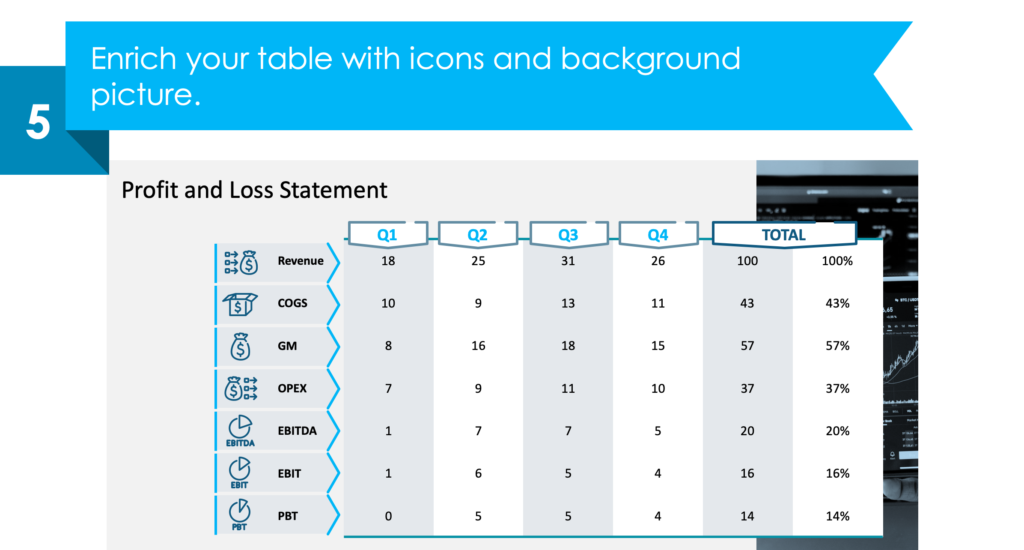
5. Enrich your table with icons and a background picture.
See the whole instruction and other visual examples here: How to Create an Effective Company Financial Report Using PowerPoint.
Need to prepare a broader annual report and focus on business highlights? See how to create a comprehensive overview of activities using graphs, icons, infographic elements, and data-driven charts in this blog.
Related Financial Presentation Templates
A financial report is just one piece of the bigger picture. Depending on what your presentation needs to cover, you might also find these specialized templates useful:
- Annual Budget & Financial Plan – if your report needs to include budget forecasts, revenue projections, or expenditure planning. Includes slides for sensitivity analysis and risk assessment alongside financial tables.
- OpEx Costs Analysis – for drilling into operational expenditures. Includes slides for Gross Margin to EBITDA bridge, cost breakdown by category, and monthly spending vs. budget comparisons.
- CapEx Investments Planning – for capital expenditure analysis and investment project evaluation. Contains CapEx approval process diagrams, budget assumptions, and project comparison tables.
- Debtors & Accounts Receivable Analysis – if your financial report includes AR aging, collection performance, or credit risk analysis. Ready-made slides for presenting receivables data visually.
For presenting your financial KPIs in a more visual format, consider using executive dashboard layouts – they work well as summary slides at the beginning or end of your financial report, giving stakeholders a quick overview before diving into the details.
Resources: Financial Report and Performance Indicators Presentation
The graphics in this blog are a part of our financial report layouts collection. Our financial review deck incorporates 30 infographic slide templates for a financial summary overview, balance sheets with assets and liabilities, financial analysis presentation, income statements, profit and loss reports, revenue and profit snapshots, cash flow statements, explain types of financial ratios, key growth drivers, or breakdown of your operational expenses.
You can reuse graphs and charts, and tailor them to your needs in order to make your slides clear and easy to understand. See the full deck here:
Using concise, modern images will make your PowerPoint structured and consistent. To make your presentations even more appealing, consider also using this collection of professionally designed diagram layouts.
More Resources to Get Inspired
If you’re looking for more design inspiration, check our movie guide on how to present financial reports, financial analyses, and financial highlights professionally (you’ll find many more practical tips on our YouTube channel):
Subscribe to the newsletter and follow our YouTube channel to get more design tips and slide inspiration.


