Activity-Based Costing (ABC): Method Explained with Visual Diagrams
Learn what activity-based costing is, how ABC differs from traditional costing, and see clear visual diagrams to explain the method in your next presentation.
Do you need to present the Activity-Based Costing Method? The ABC Accounting Model identifies the activities in an organization. It then assigns the cost of each activity. The assignment spans products and services according to the actual consumption by each.
Explore our Business Performance PPT Reports category on the website for more resources to boost your presentation impact.
As with most things, explaining the ABC Accounting Model is easier for your audience to understand if you use visual templates and graphics.
Note: All example slides below are accessible in Activity Based Costing Accounting PPT Charts (see details by clicking the pictures).
How can Creative Graphics Improve Your Activity-Based Costing Presentations?
Define Terms for Your Audience
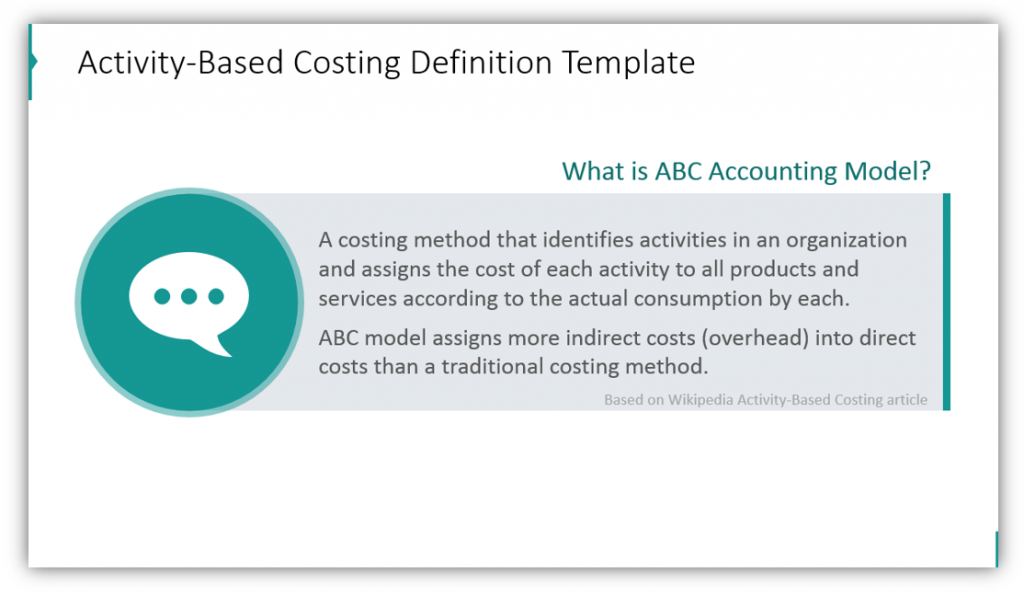
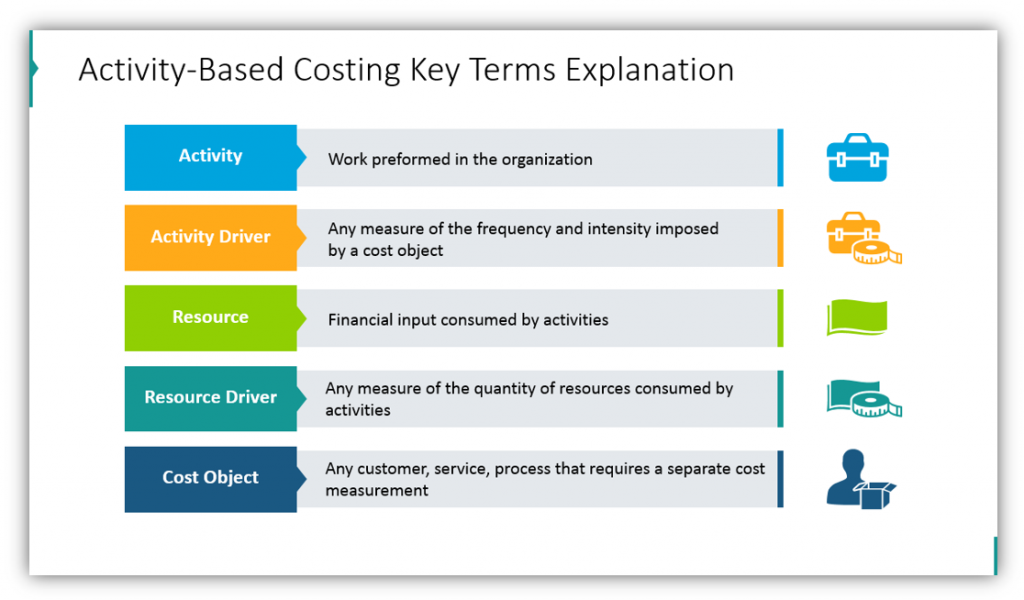
The obvious benefit of using graphics is their ability to make dense, boring information visually appealing. In this example, we are able to explain the ABC Accounting Model. The icons can be customized based on what you’re defining. The text bubble or measuring tape could easily be changed into a different, relevant icon based on the term you’re defining. The multi-definition slide or others like it could be used for shorter, less in-depth explanations.
Highlight the differences between the ABC Accounting Model and Traditional Models
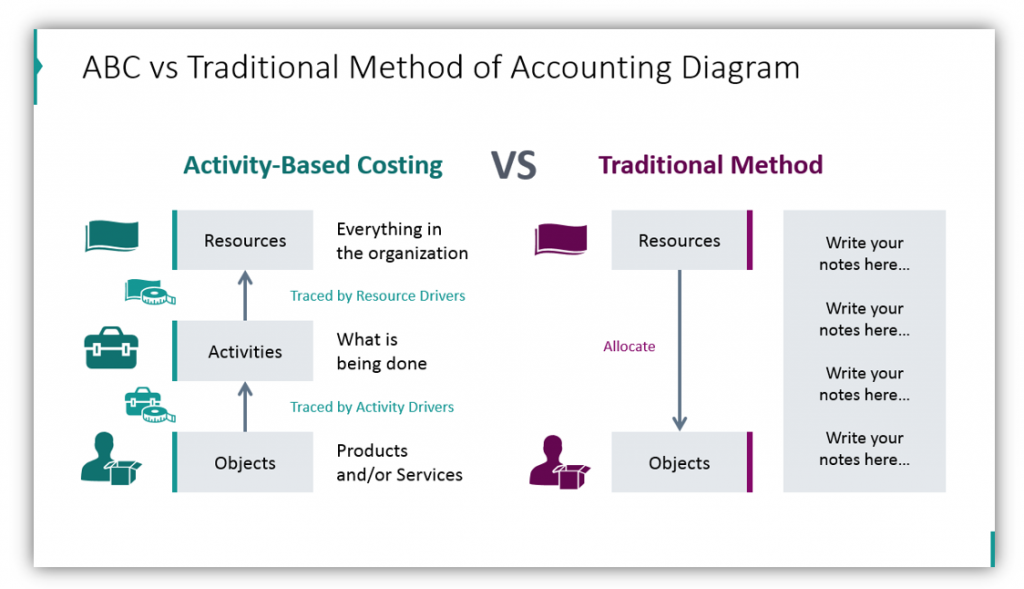
In traditional costing models, fewer indirect costs are assigned to direct costs. What does that mean for your audience? Show them! Highlight what makes the ABC Accounting Model different.
Explain the Pros & Cons of the ABC Accounting Model
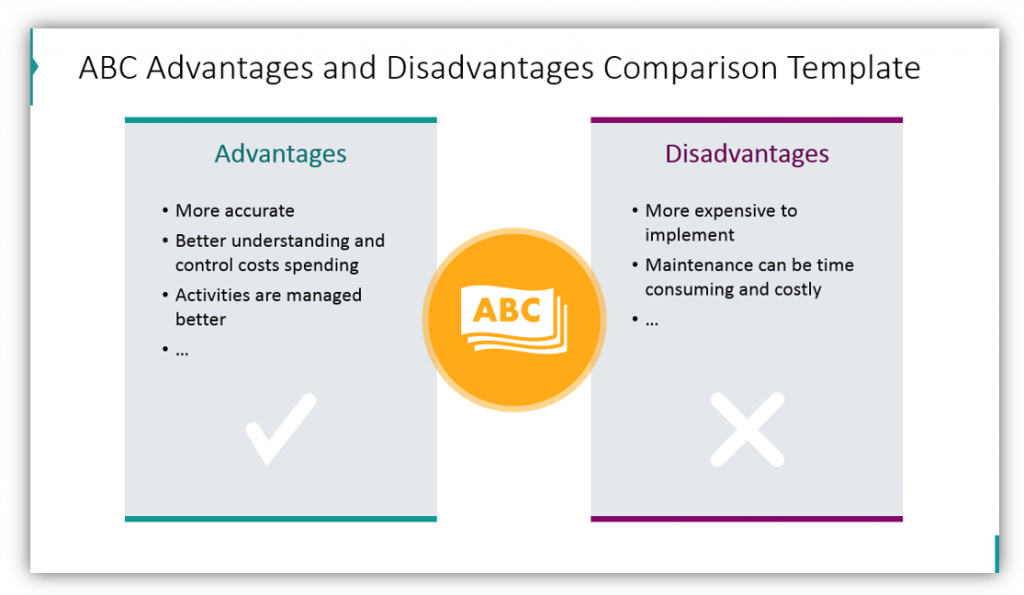
Explain the pros and cons of the Activity-Based Costing Model. Share the advantages and disadvantages. Explain how those advantages and disadvantages stack up against different models.
Utilize Activity Based Costing Flowcharts and Implementation Steps
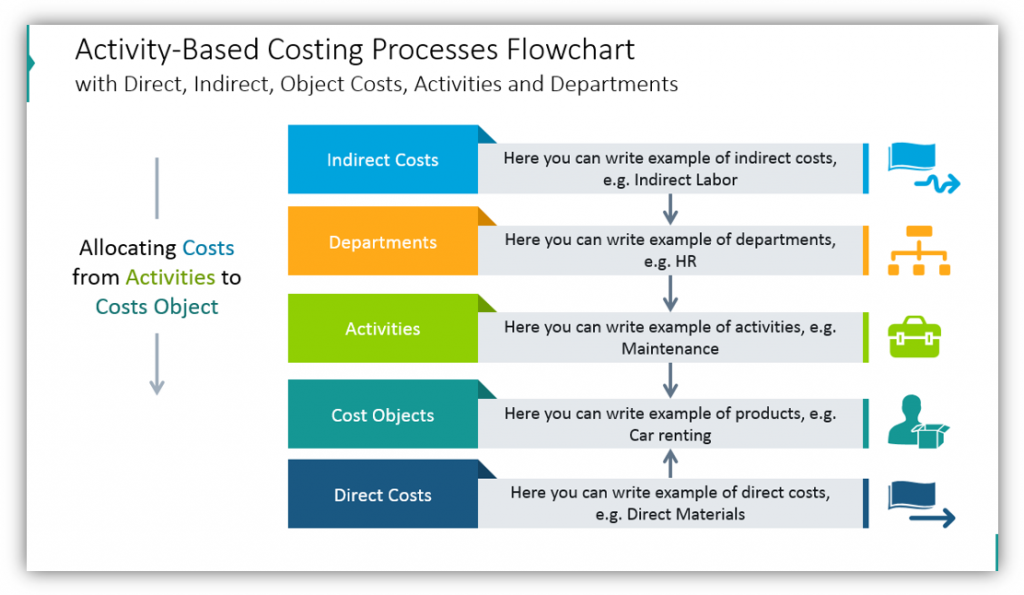
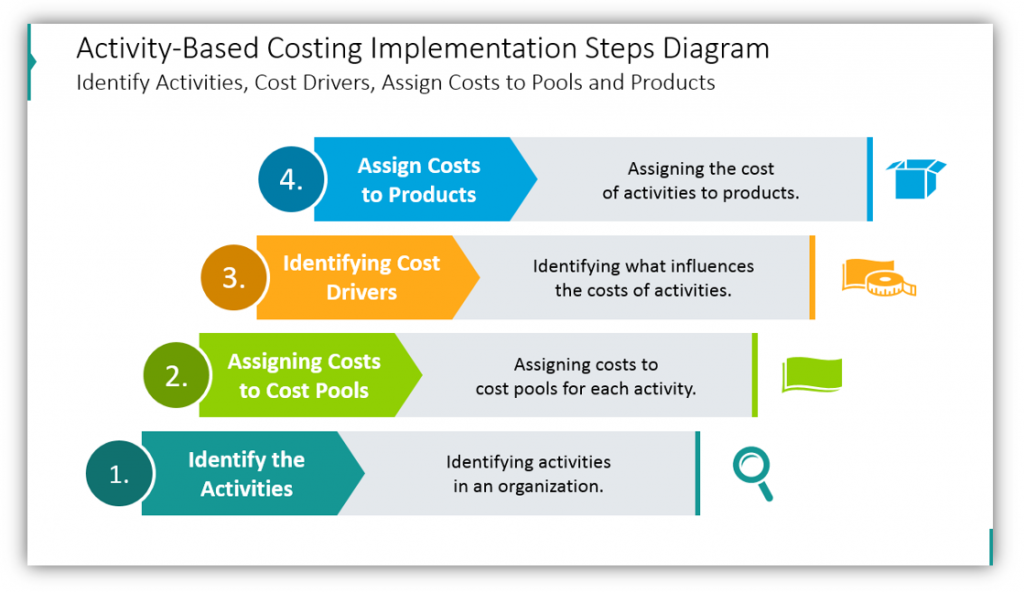
Share what the processes involved look like. The flow chart example features indirect costs, departments, activities, cost objects, and direct costs. The implementation steps diagram describes the steps required to make the ABC Model a functional reality.
Use a Table to Bring Examples to Life
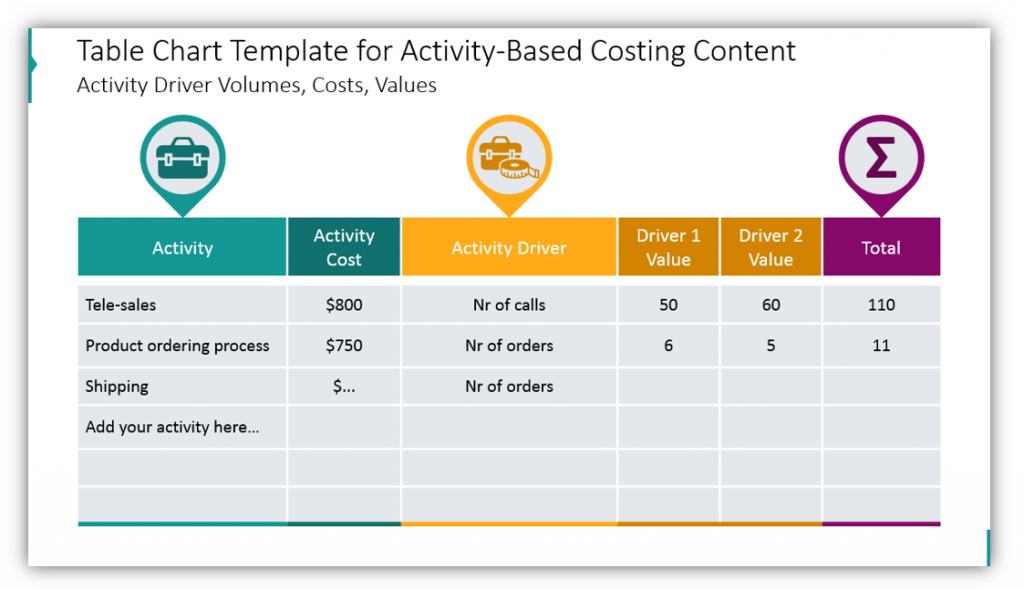
A table chart can be beneficial for demonstrating what the ABC Accounting Method looks like in practice. You can customize the colors, icons, and sizes of the images in question. After making changes, you’ll have a customized table that’s useful for breaking down how activities can be deconstructed. An activity can be looked at in terms of activity cost, activity driver, and multiple driver values.
You can define terms and highlight differences between the ABC method and traditional methods. You can break down the pros and cons of either, and then use flow charts and tables to make the concepts real to your audience.
Check our video guide on how to redesign the ABC Costing Model step by step:
Resource: Activity Based Costing Accounting Charts
By using icons and slide templates you can achieve a more professional look and consistent visual style. Professionalism goes hand in hand with competency in many cases. Why wouldn’t you take this easy step to improve the efficacy of your presentation?
Want to see the full slide deck? If you found this sampling of features of this graphics set helpful, see the full thing by clicking here:
Need more inspiration? Simple Flat Icons for the infographics collection will give you even more icon variety.


