Present Structure Using 3D Cube Diagrams
3D cube graphics are useful visuals. They serve as shorthand for complexity but also order and structure. 3D diagrams can be useful when presenting spatial locations or describing multidimensional relationships.
Look at the different styles of 3D Cube Graphics by clicking here.
How Can You Use 3D Cube Shapes?
Explain the Core Values of a Company
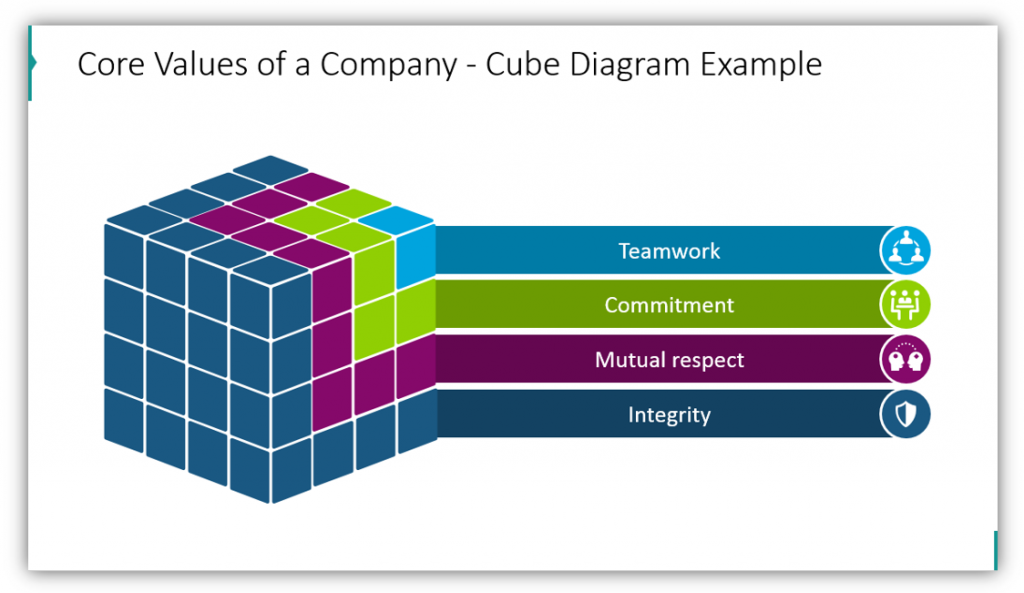
The first thing you think when you see a Rubik’s cube or 3D cube probably isn’t ‘company’ values. In this example, you see how this company values teamwork, commitment, mutual respect, and integrity. The proportion of the cube committed to each value is made obvious by the color-coding. Colors can be customized in this and any diagram which is part of the set. The icons used to represent each value can be changed to match the values you’re representing.
Use Layers to Break it Down
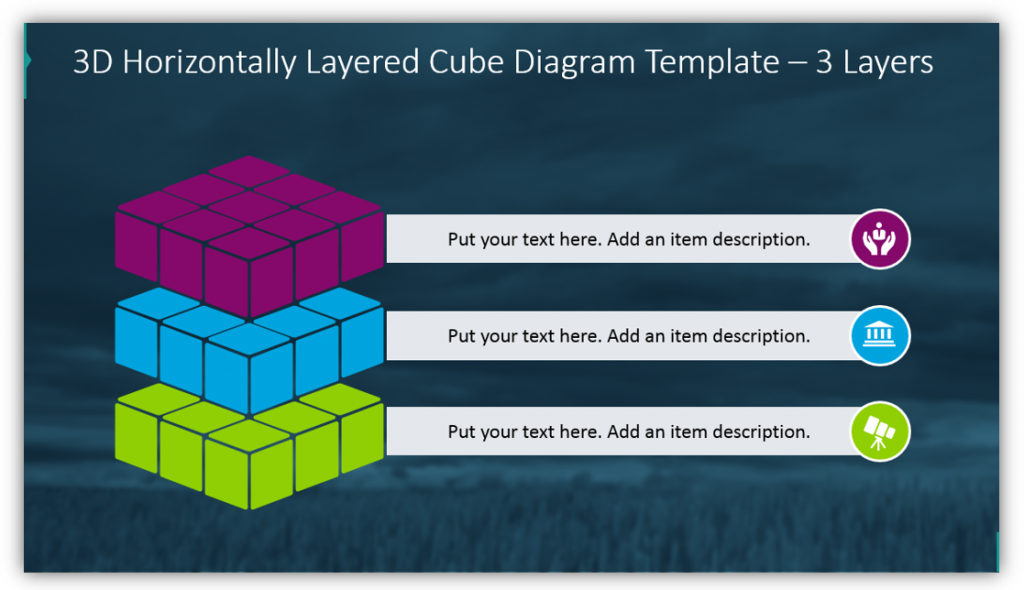
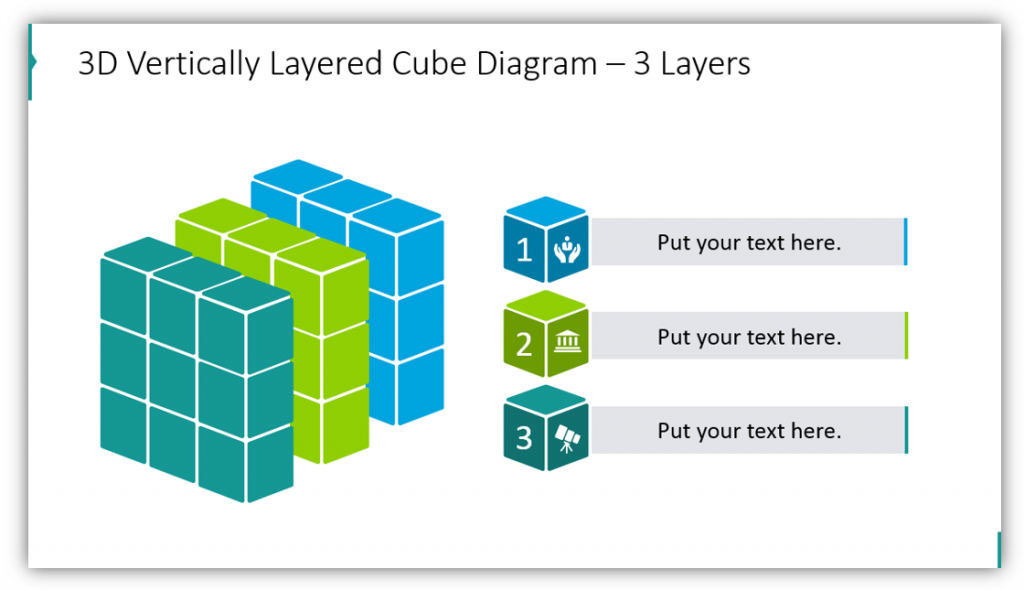
Want to describe your organization in three layers? You can easily accomplish that goal with a horizontally or vertically layered cube diagrams. The icons and colors used to represent each layer can be modified. Match your brand or audience.
Feeling creative? Want to use 3D cube graphics in your presentation? Add modern, creative flair to any presentation:
Unique visuals can help make your points in an easy to understand way.
Describe the Building Elements
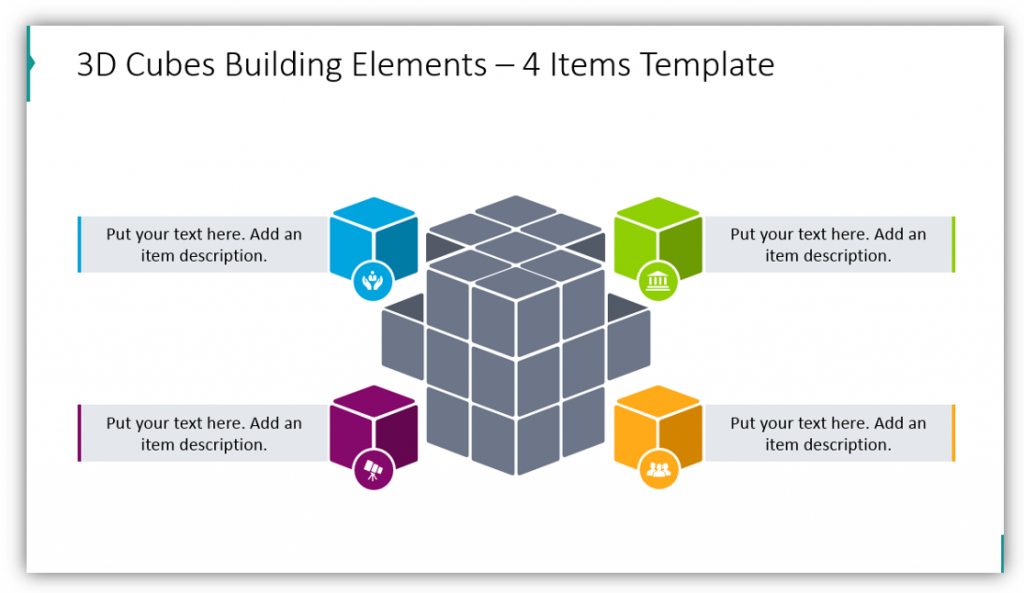
What makes up your organization? If there are four types of people, resources, or other elements which make up the whole, you can easily use creative 3D cube graphics to explain. Add supplementary descriptions to this slide so your audience has sufficient guidance. Change the icons to match your presentation subject or organization structure.
Present Client Segmentation Using 3D Cube
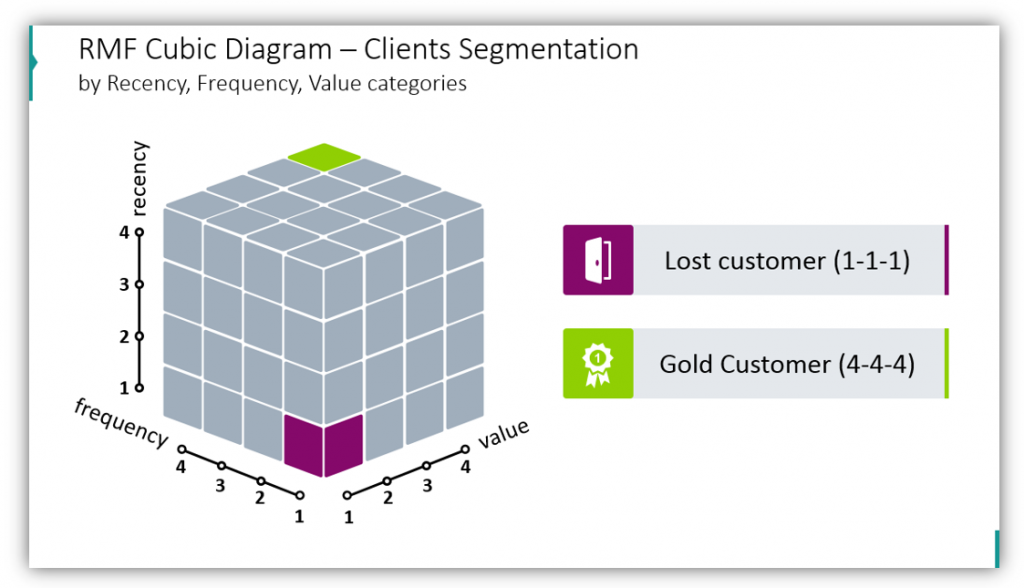
You can use Cube Diagrams to present Recency, Frequency, and Value categories. In this example, you can see how the purple cubes represent a lost customer, while the green cubes represent gold customers. Since you have the benefit of 3 dimensions, use them!
Present a List or Process
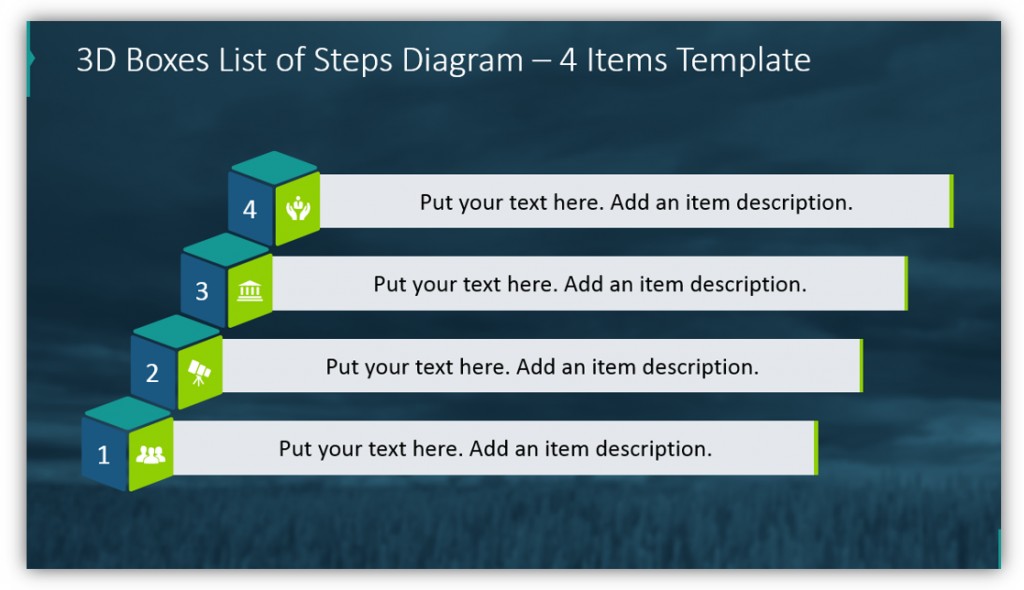
In this example, you can use 3D boxes separately. They can represent steps in a process, items in a list, or another ordered process. As with the other diagrams, colors can be modified to suit your brand or organization’s color scheme. You may add or substitute other icons to represent each item.
With cube graphics, you can present a list or process, segment clients, and use layers to break down whatever you’re sharing in an easy to understand way.
Resource: 3D Cube Box Diagram
Using images rather than text and tables alone will help your audience follow along and retain your message. The better your audience understands the message as you tell it, the better chance you’ll have of them learning what you hoped they would and retaining in the long term. Why give a presentation if you don’t want them to remember what you’ve said? Think about 3D Cube Graphics when you’re planning your next presentation.


