How to Use Branching Arrow for Creating Flow Chart Diagrams
Do you need to explain a process which splits into three or more elements? You can easily accomplish this goal with PowerPoint graphics. If you’ve tried to draw arrow shapes manually, then you know it’s difficult to create sleek, elegant curved shapes quickly. We knew it would be much easier to show a flow chart which forks with pre-designed branching arrow shapes.
Explore our Business Performance PPT Reports category on the website for more resources to boost your presentation impact.
Want to present a distribution process from one source to multiple destinations or explain a process from multiple sources to one destination? Check out the Branching Thin Arrows for Process Flow Split or Merge collection.
How can you use Branching Arrow Diagrams?
Explain a Splitting Process with a Forked Out Arrow Diagram
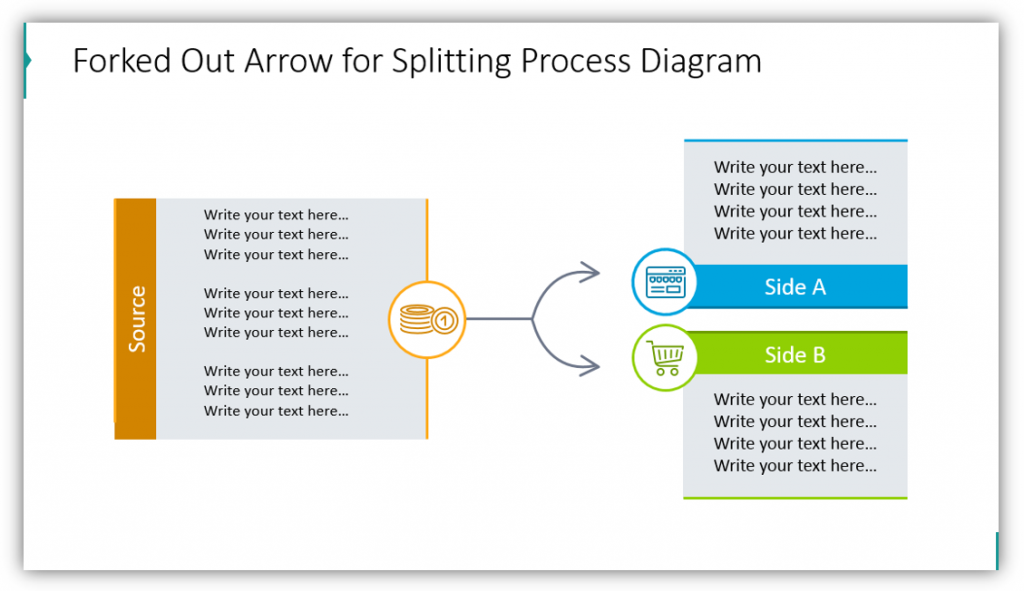
In this example, there’s one source represented with a title, description box, and icon to represent the origin of the process. That single box branches out into two boxes which are labeled Side A and Side B. These two outputs can be labeled with as many or as few details as you’d like. The icons can be customized to represent each part of the process. In the example, there are only 3 outputs, but you could easily add more if necessary.
Showcase Two Inputs with a Merger Arrow Joint Diagram
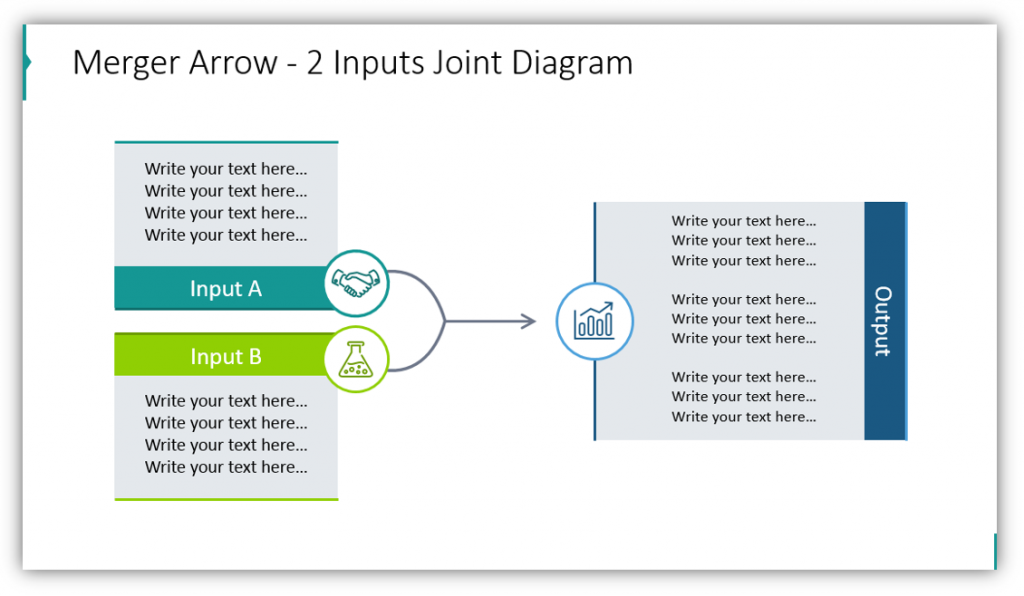
Unlike the first example, this slide features two inputs and one output. The color scheme can be customized to suit your brand or your audience, and you can see that it differs from the first example. You can also see how the icons used to represent each input and output are specific to each one. Add an additional description to supplement your presentation to each box to give your audience an easy to follow and remember the explanation.
Having sleek, modern imagery in your presentations will bolster your professionalism and credibility:
Customizing diagrams to suit your needs will make them more effective.
Use One Box to Represent Three Inputs
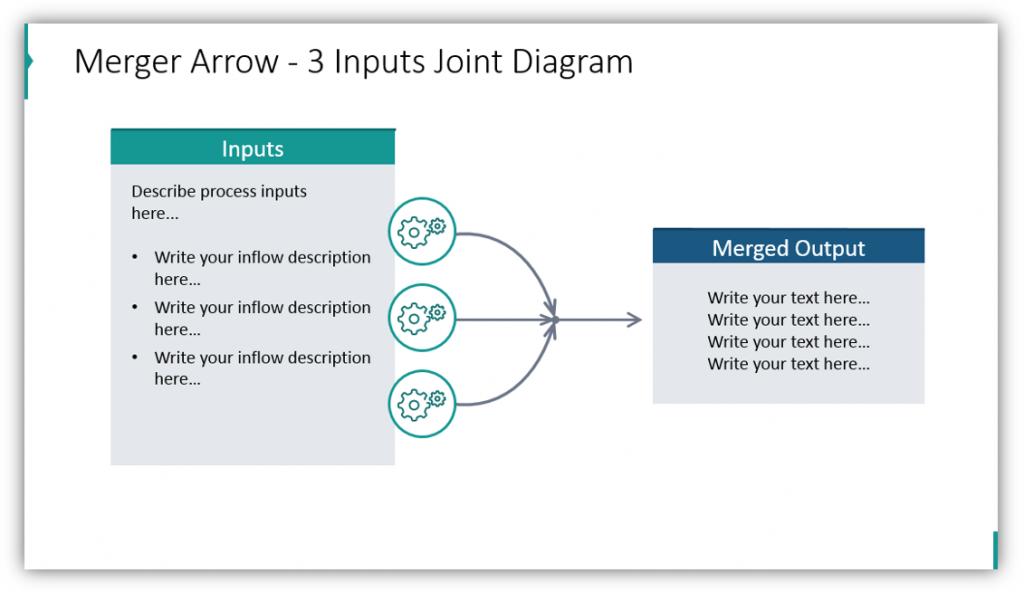
If you don’t want to have separate boxes for each input or output, that’s okay. In this sample, you see how three different inputs are represented with one text box. The icons are all the same, perhaps because the inputs all serve the same purpose or complete the same function. You would be welcome to make these different if it was appropriate for your presentation. Provide details of what these three inputs share in the description box, and describe the merged output in the merged output box. Change the label and text to something appropriate to your presentation.
Explain Your Production Goals using Branching Arrow Shapes
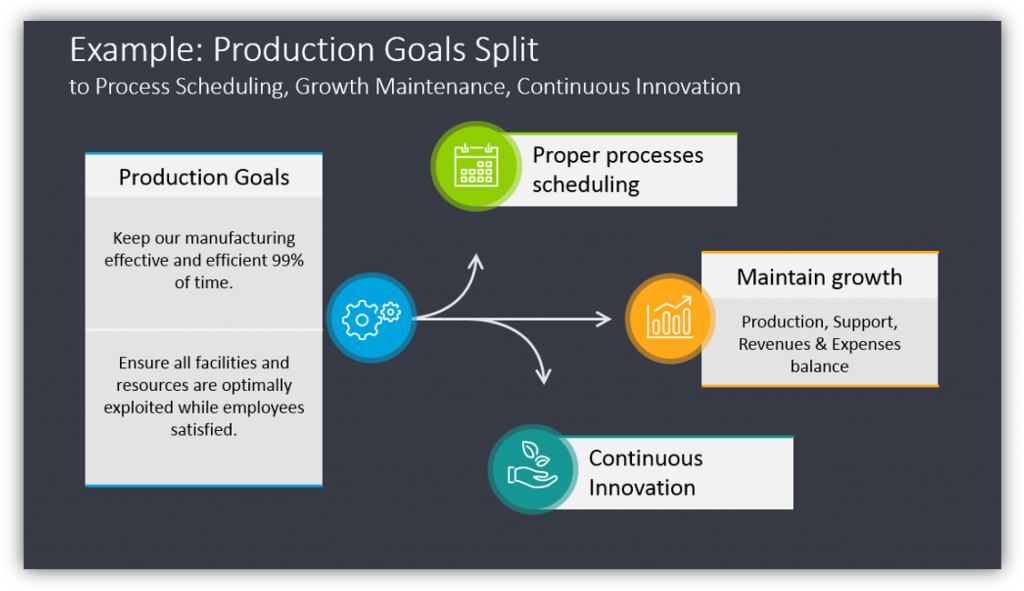
You have production goals and need to express how you hope to achieve them. By providing your production goals in a large text box, you’re setting expectations for your audience. Whether you’re explaining your goals to your production team or justifying performance to superiors, you can help them understand. Then explain the different pieces of the process which will help you achieve those goals. In this example those outputs look like Proper process scheduling, maintaining growth, and implementing continuous innovation. Think about what those outputs are for your organization!
Use Vertical Arrow Fountain Diagrams
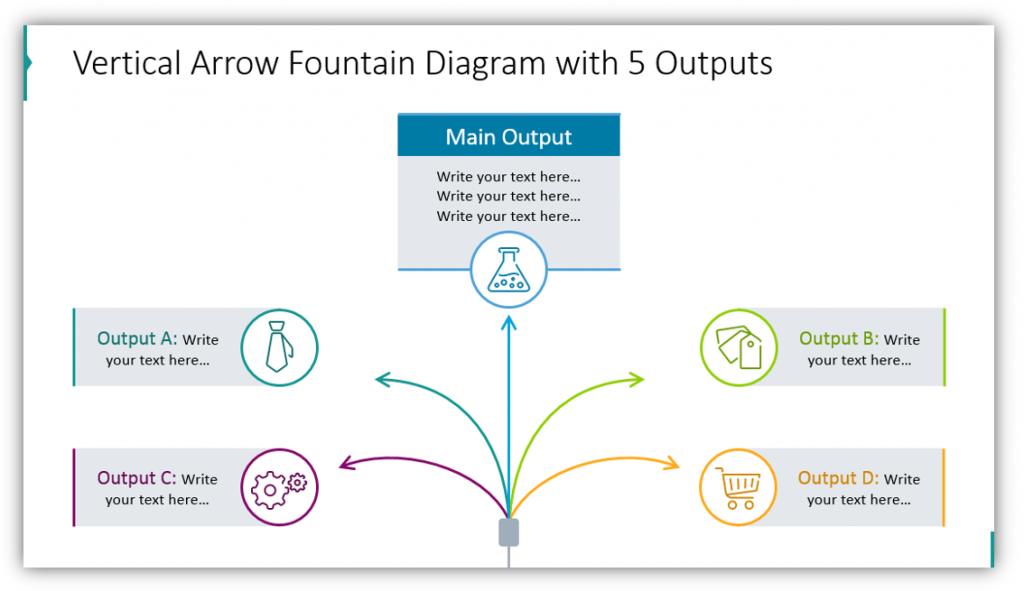
This example has five outputs. There’s one main output, and then four supplementary outputs. This diagram proves that branching thin arrow diagrams do not have to extend horizontally. Think about what it is you’re trying to convey in your presentation. Which layout makes the most sense? Take those details into consideration when planning your slide layouts.
Explain processes that fork from a single input or into a single output. Use a fountain in place of a flow chart to provide a creative, visually unique impression on your audience.
For more inspiration, subscribe to our YouTube channel:
Resource: Branching Arrow Shapes for Process Flow Split or Merge
Creative, interesting graphics will help you make your points. It might be difficult for your audience to visualize all the different components which come together or see how one input can split. With the Branching Thin Arrows for Process Flow Split or Merge set, you can show them.
Not sure what to use to customize your slides? Remember you can add additional icons and graphics from Outline Business Icons for infographics. Eye-catching graphics will make a better case than plain text lists, tables, and charts on their own.


