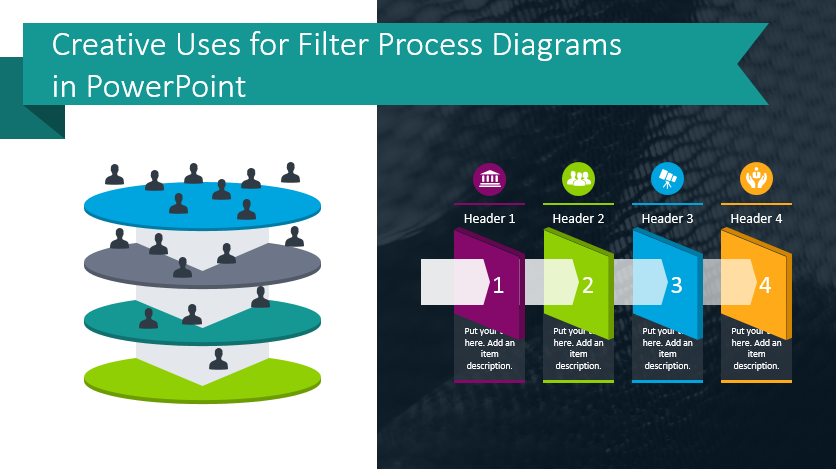
Creative Uses for Filter Process Diagrams in PowerPoint
Do you need to present or explain your client selection process or recruitment processes? Filter process diagrams are meant to illustrate the different stages of sales and marketing. They make it easier to present a large amount of information. The structured way information is presented will help your audience understand your message.
Need to highlight your purpose in a simple, unique way? Click here to see the Filter Process Diagrams collection.
How can you use Filter Process Diagrams?
Demonstrate Horizontal Filtration
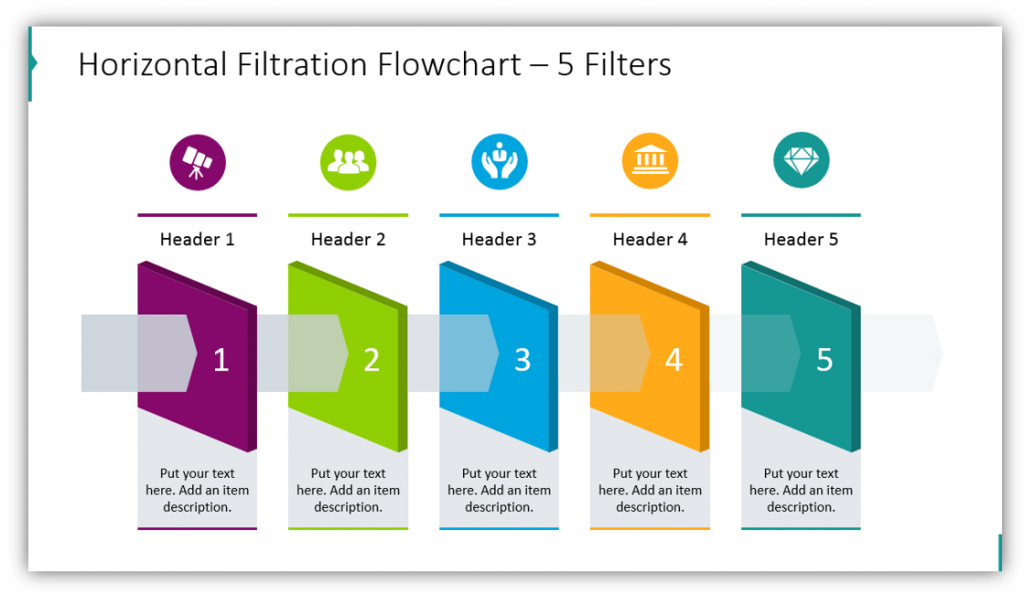
Horizontal filtration flowcharts like this one can show how you narrow your client selection. Alternately, if you need to explain how you recruit additional staff, you can do so easily with one of these charts. In the example, 5 steps are shown but you can easily use fewer steps. You can add details and descriptions to this professional diagram.
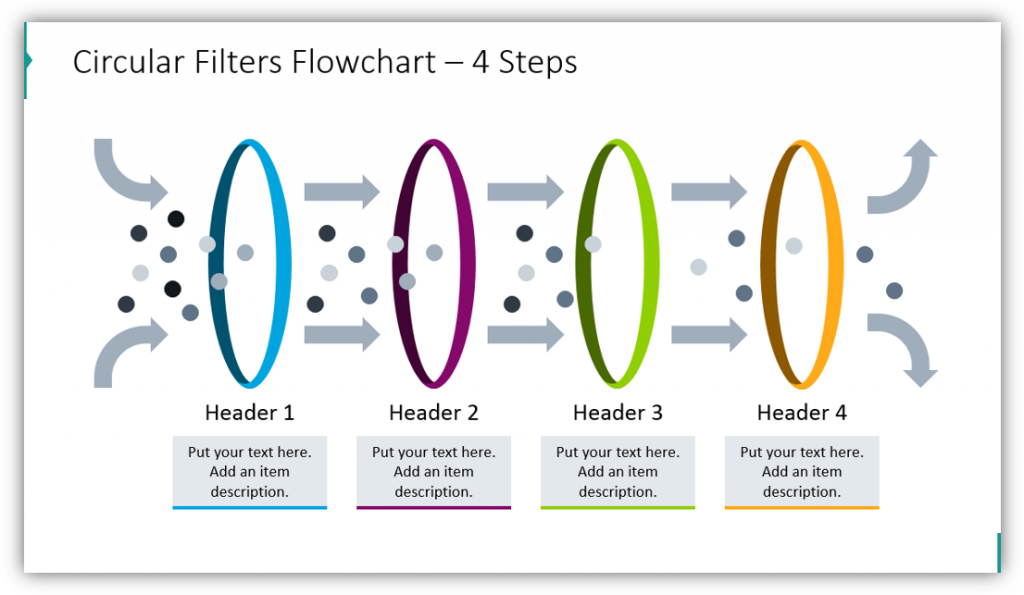
Use a Filtering Process Diagram with Particles
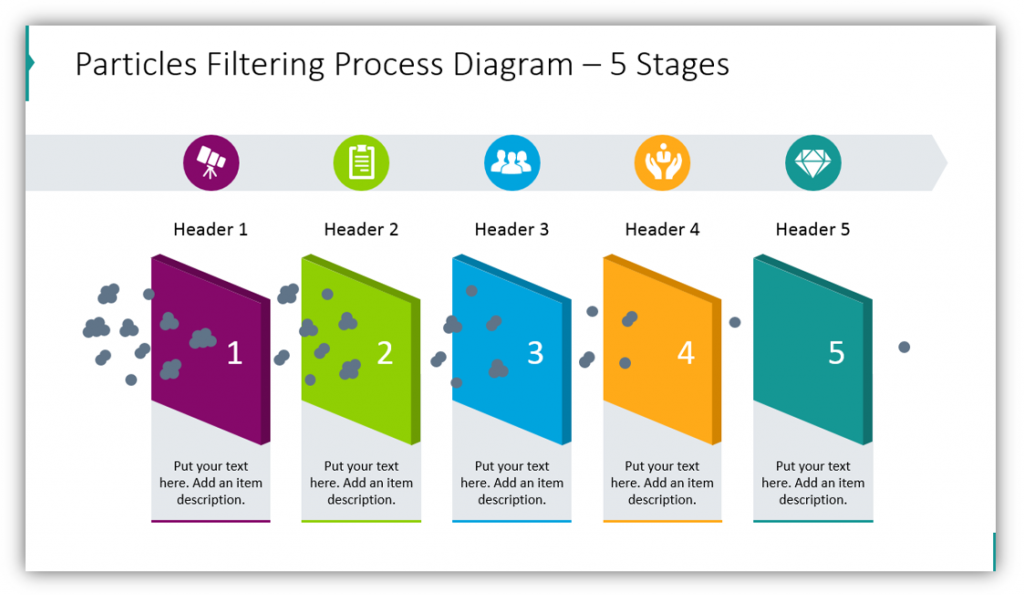
If you want your metaphor to be even more powerful, use a Filtering Process Diagram with particles rather than a flow chart. You may still add supplementary details and customize the colors and icons featured on your slide. The only difference is that your audience will be able to see the difference between level 1 and level 5. They will see the different number of particles which appear at the beginning versus at the end of the process.
Use Filtration charts in presentations when you want to describe your workflow process, or for any other purpose you can dream up. Replace bulleted lists with text with these interesting PowerPoint charts:
Explain Your Sales Funnel using Filter Process Diagrams
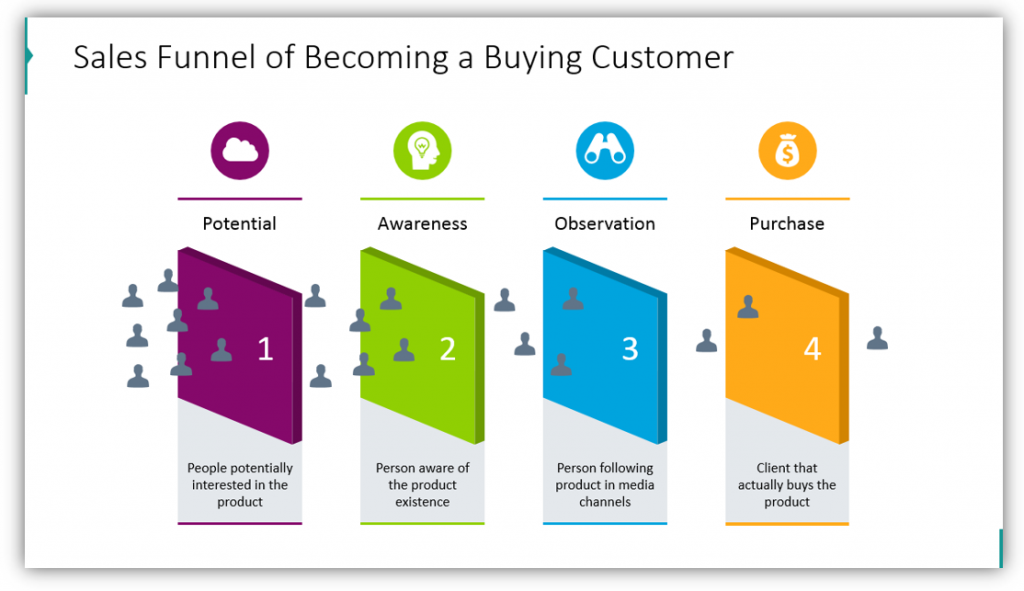
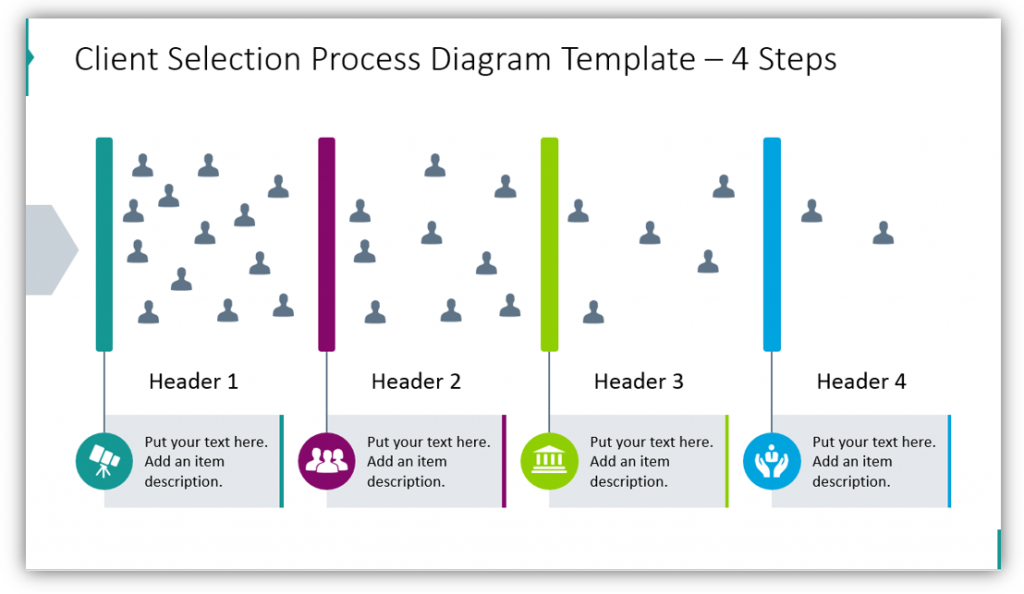
When describing your customers, it may be helpful to represent them with small human-shaped icons. In this way, you’re not showing your prospective clients as tiny specs, but as people. Whether you have 4 filters or many more you can add details and the title to best represent each step of your sales funnel process. If you don’t like the look of the 3D sales funnel, you can use a more two-dimensional version.
Use Ring Filters to Explain Your Process
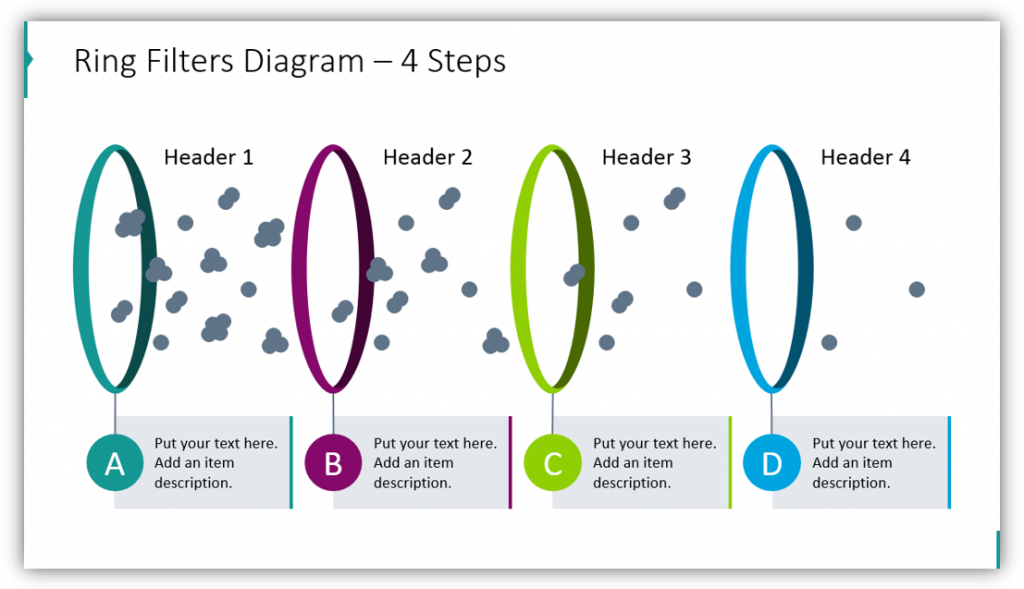
Perhaps it doesn’t make sense to you that a filter would be completely solid. If you would prefer to use rings to represent the different stages your prospects or potential recruits need to pass through, there is a diagram set for you. This set features letters which label each individual layer, but you could easily incorporate an icon to represent each stage instead.
Use Arrows to Make a Different Elements Filtration Model
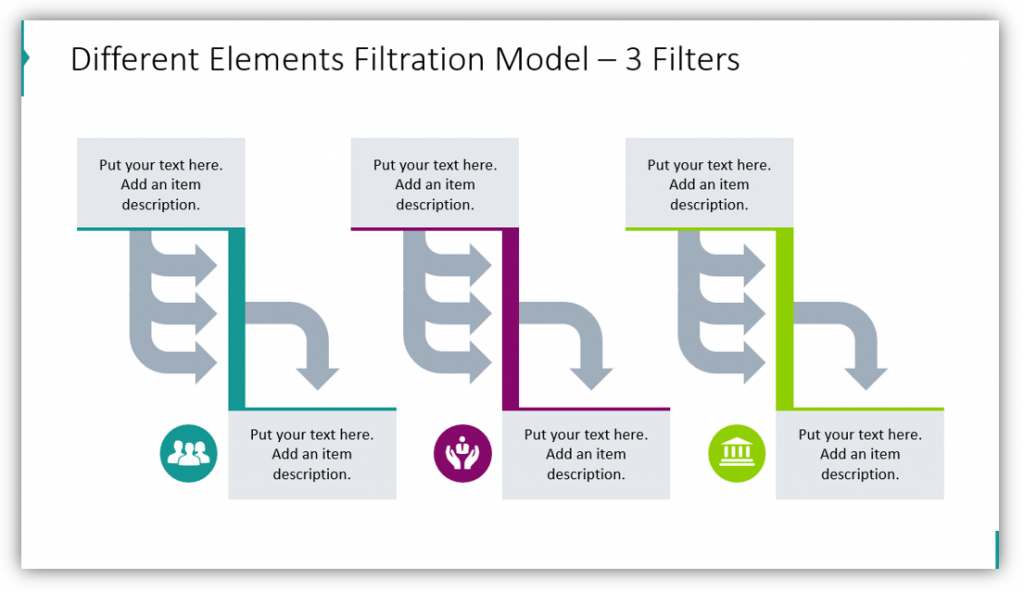
In this example, you can provide additional supplementary details. You describe both what happens before the filtration step and after so your audience has a clear understanding of what’s happening. You can add supplementary icons or labels for each layer to ensure your audience can easily follow along with your modern visualizations.
Demonstrate horizontal filtration with flow charts, particles, or rings. Explain your sales funnel and humanize your prospects by making the dots which represent them into small people. You can also go even more big-picture and represent the filtration process with arrows.
Resource: Filter Process Diagrams
To help you out presenting processes inspired by filtering idea, we’ve designed set of filtration diagrams for PowerPoint. Use them to visualize your work processes and selection procedures.
Customize the color scheme of this varied icon set to match your audience’s expectations. You can focus on your own business color scheme, or if you’re making a presentation for a prospective customer you could match the graphics to their color palette. Incorporate icons to represent each stage, or leave it more nondescript so your audience is free to use their imaginations.


