Make Creative Presentations Using Orbit Diagrams and Infographics
Do you have to present a topic with one central theme or element? If the concept or relationship you are presenting all revolve around one central element, orbit diagrams might be right for you.
Use Orbit Diagrams to tell your story
The solar system is a powerful visual metaphor. Science classes around the world begin teaching the structure of our solar system early. Although some of the details have shifted over the years, such as how many planets there actually are, the fundamental structure has remained essentially unchanged and is universally understood.
We created the Orbit Graphics PPT set to help utilize the power of an easy to follow, universally understood visual.
How should you use orbit diagrams?
1. Show the relationship to a central idea
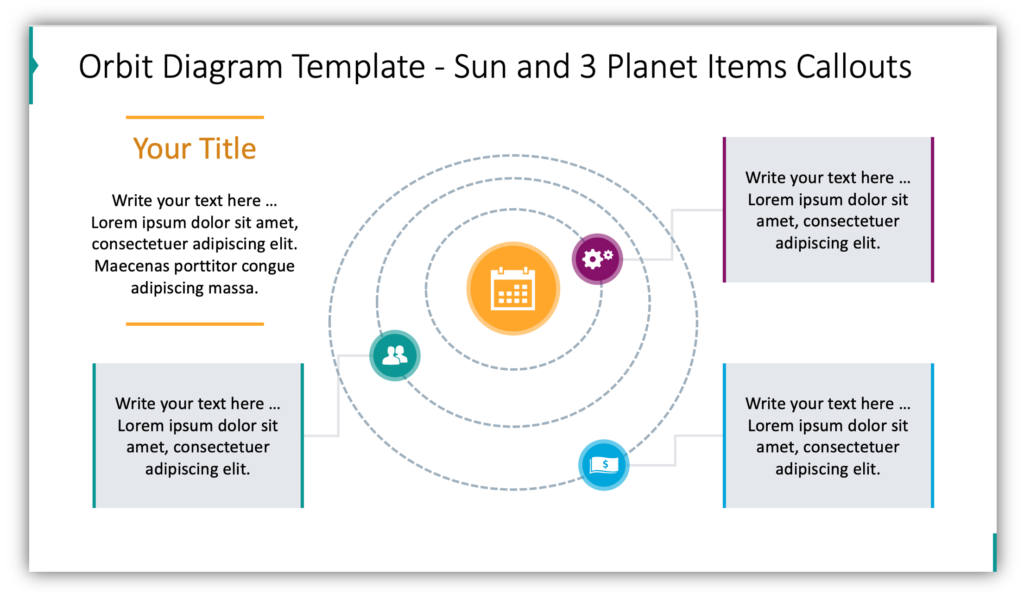
Perhaps you need to explain how staff, capital, and infrastructure all revolve around your timetable. Add supplementary details in the description boxes. Ensure your audience knows enough to follow your presentation and can understand the points you need to make.
2. Use half orbit diagrams
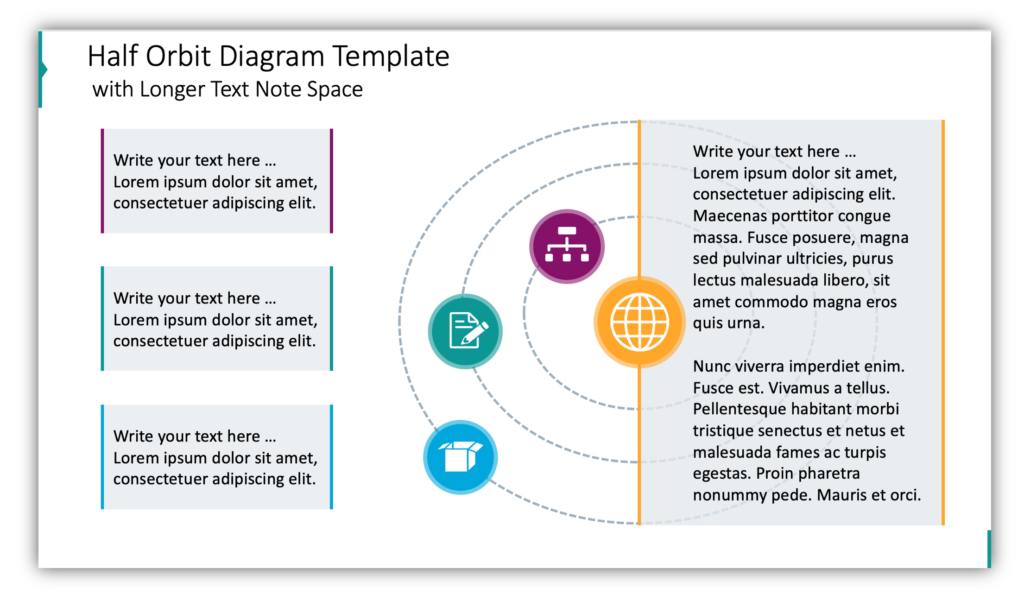
Does the central element of your solar system diagram need a lot of explanation? Half orbit diagrams give you the freedom to add details or notes. You’ll want the majority of your information to be presented rather than read from your slides, but you can add important details you don’t want your audience to forget to the slide so that it may serve as a visual reminder. Remember, visuals are powerful. That is why we want to use orbit diagrams in the first place.
3. Explain the corporate structure and physical locations
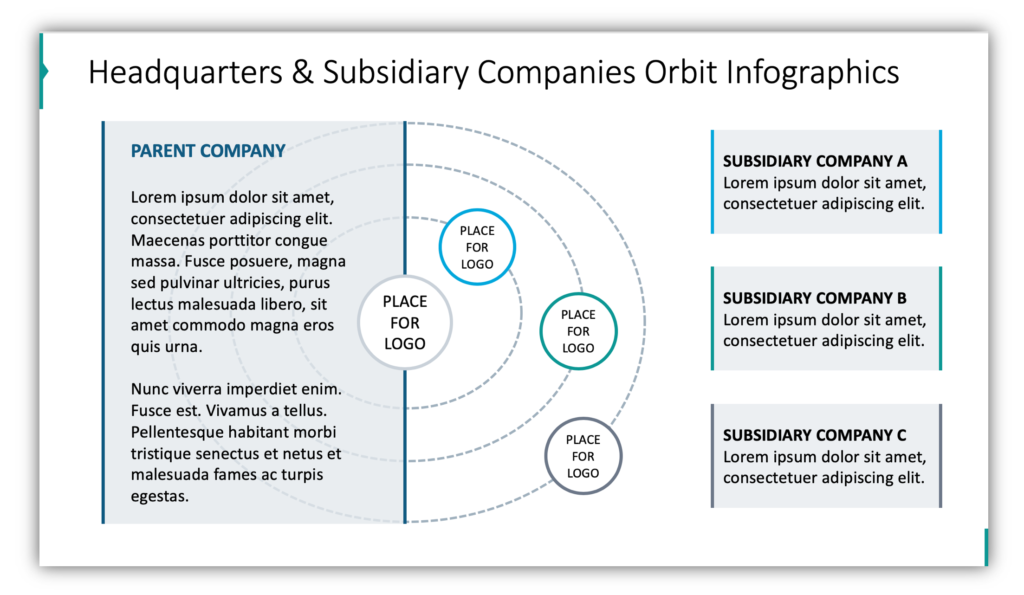
If your company owns smaller entities or has several locations, orbit diagrams can help you explain the structure. Company logos, such as the parent company and the subsidiaries, can be helpful and intuitive. If you’re using an orbit diagram to explain multiple locations of the same company or describe how different departments make up an organization you can instead use icons to represent landmarks, geographic features, or the functions of the different departments/locations.
4. Make your presentations more sophisticated by adding moons
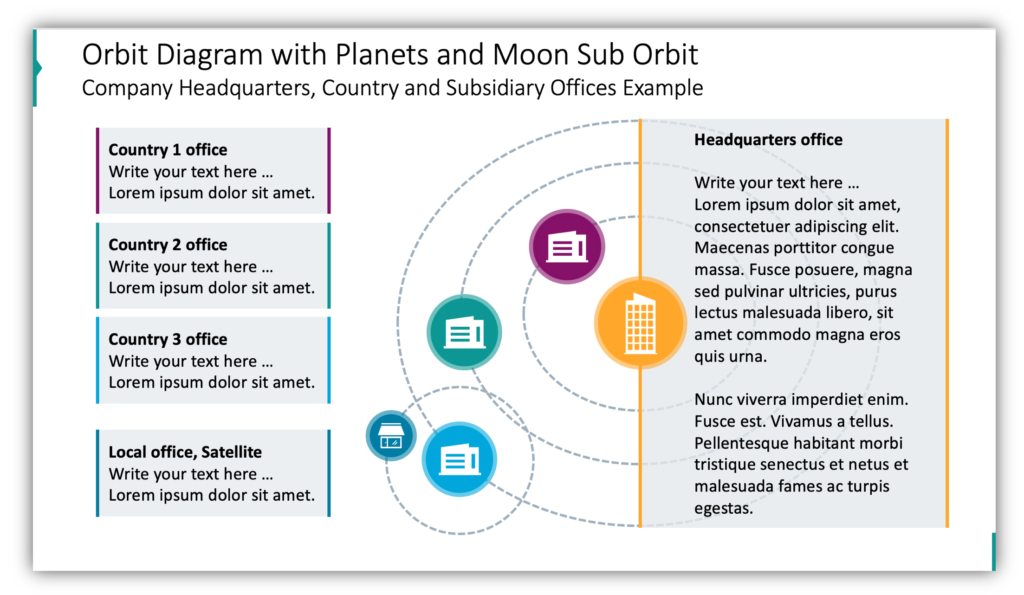
What if not everything revolves around a singular element? That’s okay. You can add additional orbits to any element. In the example the regularly orbiting items are offices. The moons, additional orbits, can be things like local, satellite offices or event freelancers who work outside of your actual locations. The great thing about orbit diagrams is that they can be modified to suit your needs.
Use pie charts and orbit diagrams
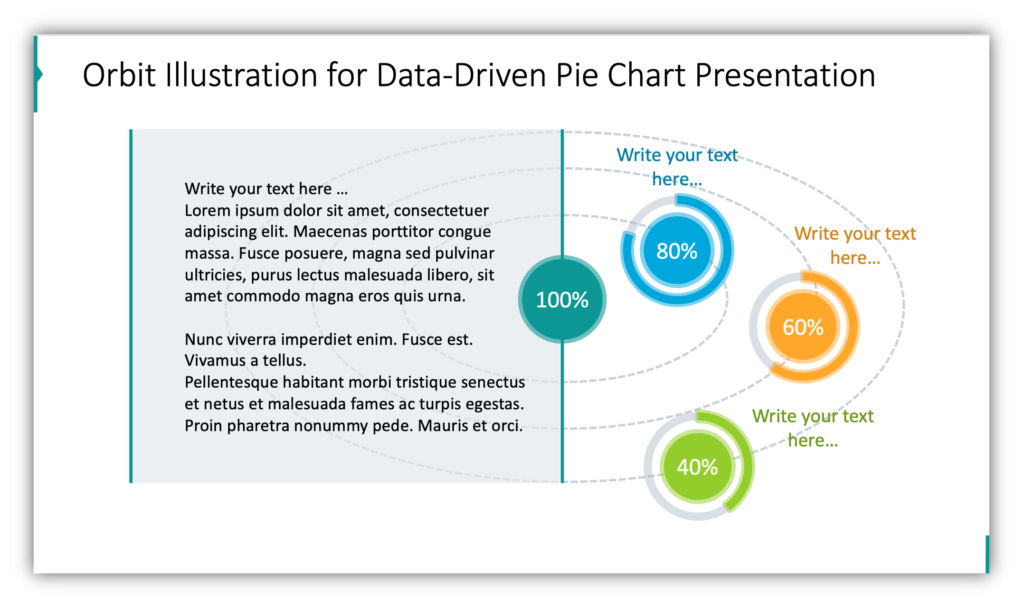
Do you want to use orbit diagrams for your data-driven presentation? You can incorporate pie charts into an orbit diagram. This is helpful if your orbit presentation is to explain your progress toward a goal or the progress different departments are making towards their own goals. This is a great deal of information to present, and support with graphics, on one slide.
Represent stages, locations, tasks, and more with Orbit Diagrams
Orbit diagrams are more interesting and visually compelling than tables. They are an impactful way to creatively express what you need to.
Resource: Orbit Diagram Infographics
Orbits make great visuals for abstract and complex ideas. You can use them to help your audience follow along. Beautiful, easy to understand visuals make a wonderful compliment to well-executed presentations. Giving your audience a fresh take with unique visuals will make your presentation memorable:
Using graphics and diagrams, you can put your ideas together with a powerful visual metaphor. Need more graphics to customize the visuals? Check out the Modern Flat Diagrams ultimate bundle.


