Use Creative Graphics to Present Your Customer Experience Journeys in PowerPoint
Do you and your team give much thought to your customers’ experiences? If you need to present your customer experience journey, you might be at a loss. What does that look like? Depending on who your audience is, you might need to explain what the phrase “customer experience journey” actually means before you can even start.
Why use Customer Experience Journey Diagrams?
The customer experience often contains several parts. They start with awareness and if all goes well ultimately reach the retention and advocacy stages. With the help of a customer journey map, you can understand your customers’ motivation, pain and get ideas for improvement. The map illustrates the process of building a relationship between a brand and its clients. Professional graphics and diagrams will help you organize your information in ways that are easy to understand.
Bring customer experiences and a roadmap of their personal journey to the forefront of your audience’s focus. Click here to see the full Customer Experience Journey PPT Diagrams set and imagine how you might put them to work.
Share Compelling Quotes

Whether you choose to use quotes from industry experts about the importance of customer experience at large or quotes from your own customers about their experiences, quotes can set the stage for your presentation. Let your audience know how important customer experience is with a quote at the beginning or share different customer experiences to set the stage for different portions of the presentation. The options are limitless!
Use a Roadmap Metaphor to Explain the Customer Journey
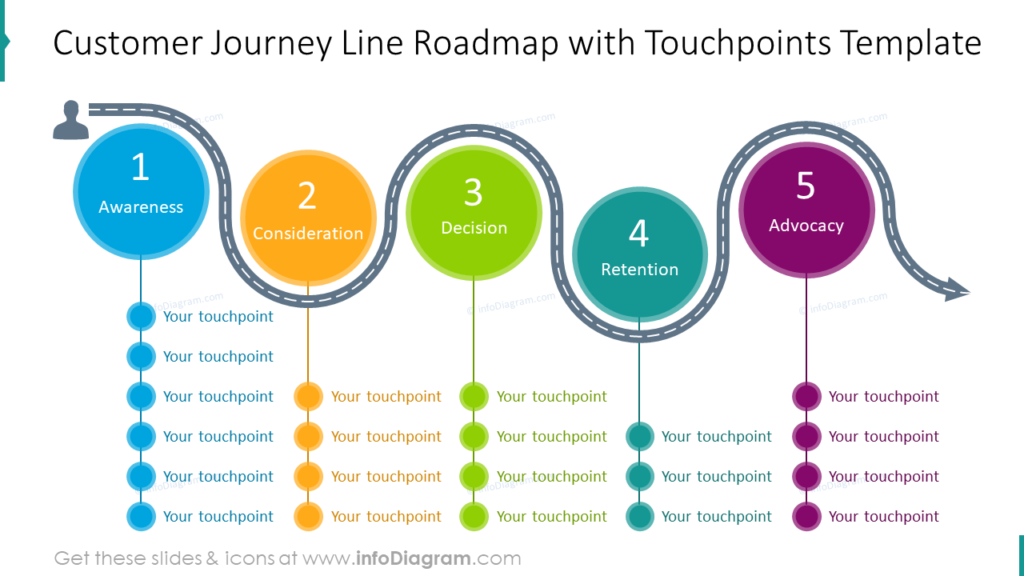
Using a roadmap to represent a journey is a perfect metaphor. In the example, each circle represents a different stage of the customer experience journey. The items listed below, represented by the smaller circles, represent different touchpoints at each stage. Once those touchpoints are complete, the customer often makes the transition to the next stage of the journey. If you would prefer not to break down the touchpoints of each stage, you can provide descriptions or details, instead.
Pyramid Diagrams Represent Customer Journey Levels
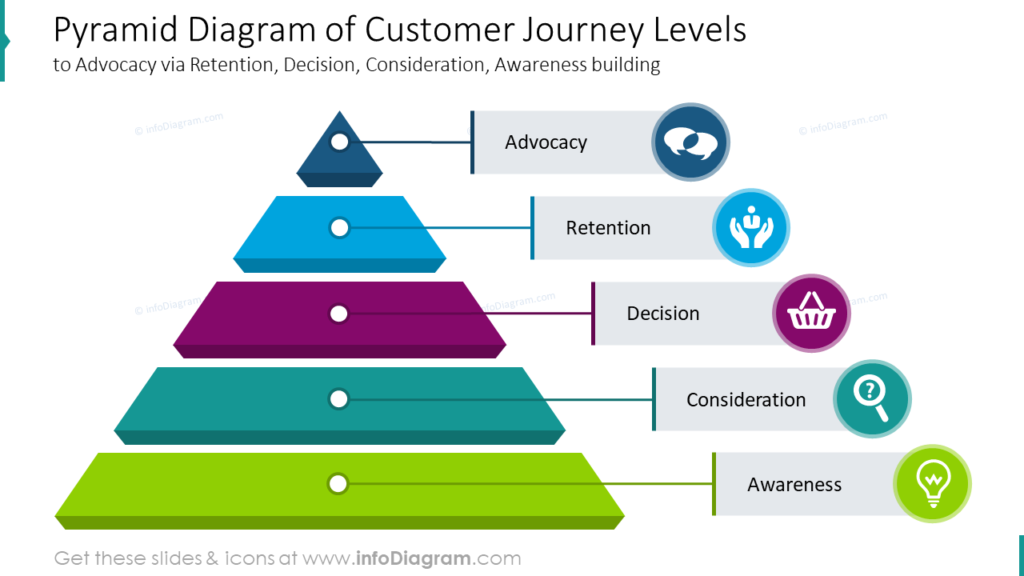
If the road map diagrams explain how the customer proceeds down the customer experience path, then the pyramid diagram is useful for illustrating the quantity of customers that are at each stage. Because brand awareness is the broadest, most general level of customer experience it is where most customers and potential customers will be. The smallest number of individuals will likely be at the advocacy stage, the very top of the pyramid. Although you want to raise the number of individuals at any level, the number of people who are aware of your brand will always be greater than the number of people who are actively advocating for others to try your goods or services.
Use Funnels to Explain B2B Client Journeys
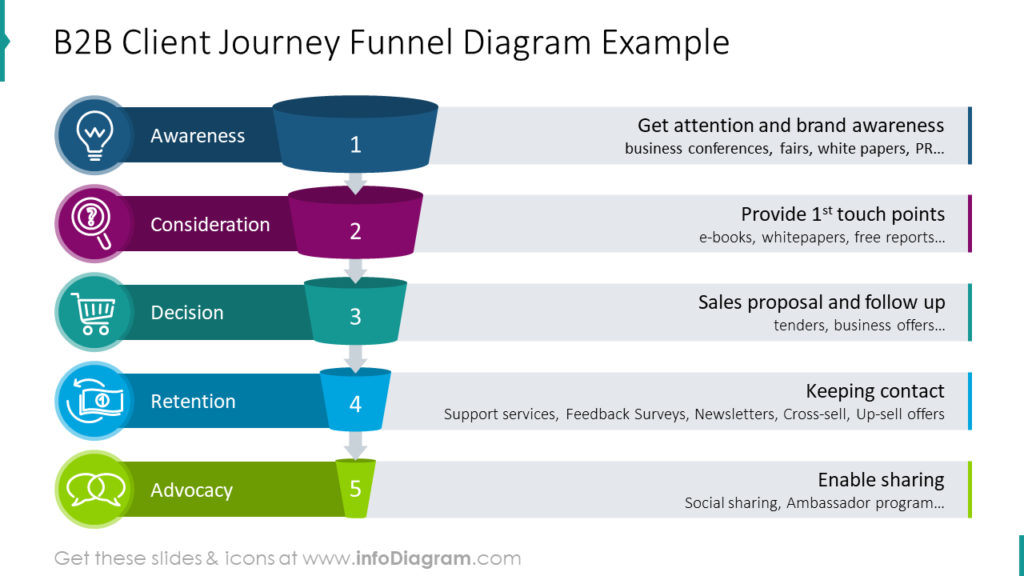
Client journeys aren’t just B2C phenomenons. This funnel slide template explains how the same stages of client experience apply to B2B situations. Supplemental details that apply to your business can easily be filled into the descriptive boxes at the side. Since they are small, they aren’t likely to be overburdened with the addition of too much text.
Present Your Online Customer Experience Journey With a Less Rigid Diagram
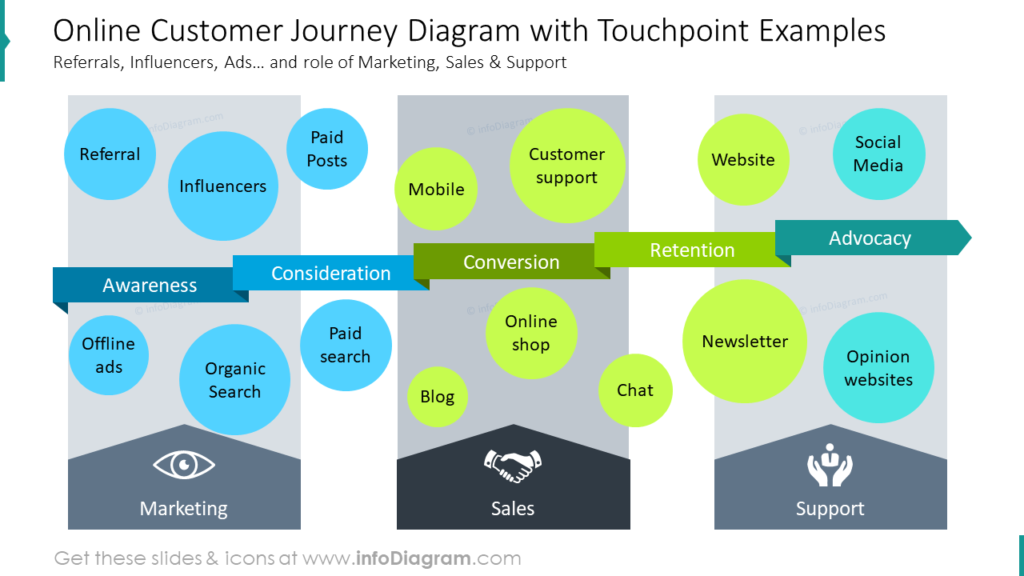
When conducting business online you have a variety of possible touchpoints at your disposal. In the example, the three main types of touchpoints fall into the categories of marketing, sales, and support as those are the primary methods of engaging with your online audience. The different stages of the customer experience journey are the same, but they overlap with those categories. You can easily color-coordinate the different touchpoints to match your branding or to match other slides in your presentation for a cohesive visual message.
Compare Your Goals to the Customer Journey
Do you have goals related to customer acquisition, retention, or advocacy? Compare your performance in those areas with your strategies and see where you might be falling short. Use what you’re doing well to gauge how you might do better in the areas you need to improve.
Resource: Customer Experience Journey Diagrams
Presentations about multi-phase processes can easily become overwhelming to audiences. Especially if the presentation is meant to be instructional or corrective in any way. By using Customer Experience Journey Diagrams you can communicate full ideas while reducing repetitiveness:
Beautiful, easy-to-understand graphics will help your audience understand your presentation, therefore allowing them to ask better questions and absorb more of the material.
Pre-made, impactful visuals will help you make your presentation visually cohesive so your slides don’t detract or distract from your message. By having full diagrams to explain processes, you can cut back on the number of slides which are necessary, which will help your audience focus. Easy to read, organized messages are better for them and better for you. Click here to see our fresh collection of sleek infographics templates.


