Present Stakeholder Analysis with Creative Modern PPT Diagrams
Who are your stakeholders? If you need to explain the stakeholder analysis and how your community and other stakeholders should factor into your business strategy, processes, or finances you may benefit from stakeholder graphics. Organizational structure, including stakeholders, are often varied layers. Using visuals on your slides rather than relying on paragraphs or your spoken words will help your audience conceptualize and understand these abstract ideas.
Elevate your business performance presentations with our curated resources – visit our financial performance PPT reports webpage.
Why would you use Stakeholder Analysis Graphics?
Visualizing the relations between various stakeholders is challenging. Especially if your audience is unfamiliar with your subject matter. You would use stakeholder graphics to help your audience understand your message and remember your presentation.
Map your stakeholders, and their interests, and create a power/interest matrix grid all with one set. Want to see even more possibilities? Click here for the full Stakeholder Analysis PPT Diagrams set.
Are the members of your audience total novices?
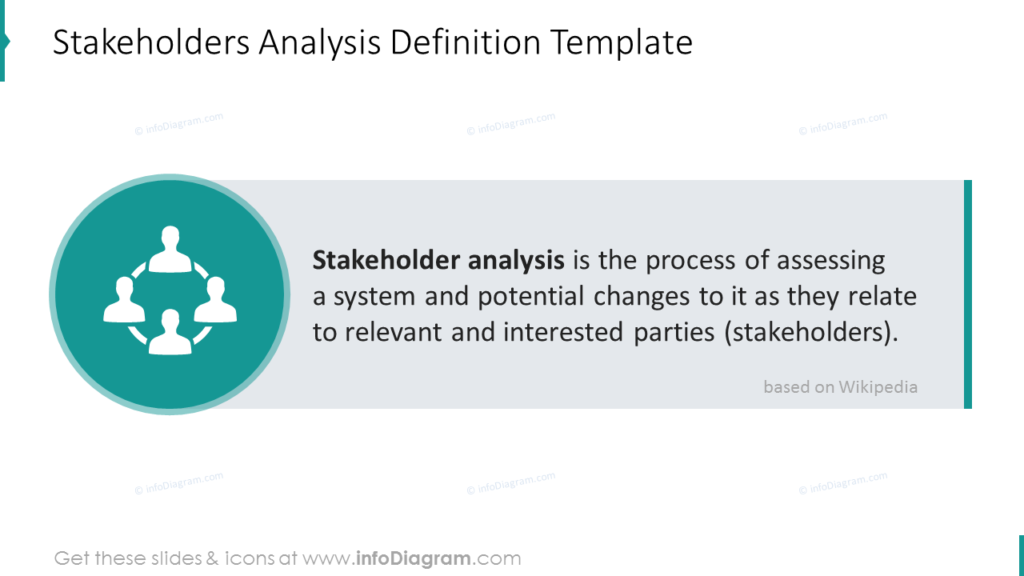
If members of your audience are beginners, you may need to define terms prior to launching into your presentation. If your audience doesn’t comprehend the technical terms you’re using they won’t understand your presentation. If they aren’t familiar with the concepts you’re breaking down, they won’t be able to absorb your message. These slides can also be useful for providing additional details or descriptions following slides with layers or other complex diagrams.
Stakeholder Analysis Onion Layer Diagrams will help you explain the structure
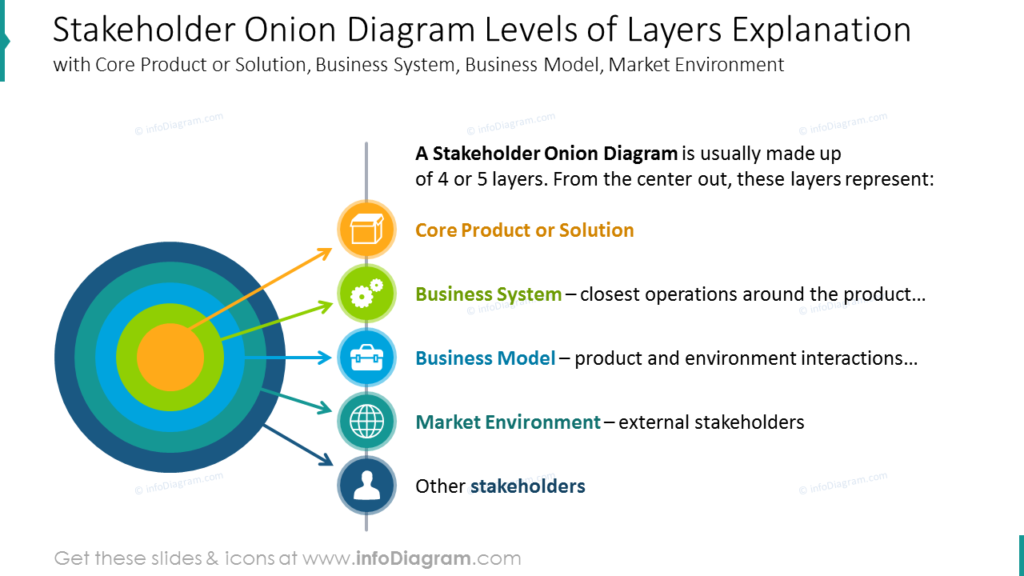
If you need to explain the layers of your organization and how stakeholders factor in or break down the layers of stakeholder involvement, a stakeholder onion diagram can be a great help. This perfectly round diagram is aesthetically pleasing, modern, and very clean. What’s even better is it’s uncomplicated, so your audience won’t be bogged down trying to process the image. Color-coordinate the diagram to suit your audience or organization, and match the icons for each layer to the level you’re explaining.
Stakeholders Identification Analysis
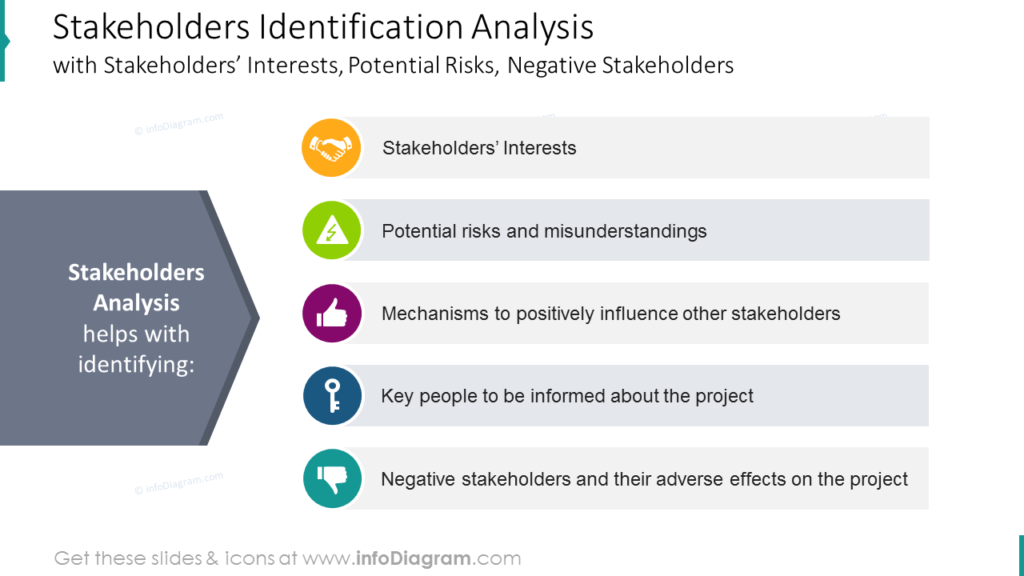
Do you need to explain your stakeholders to your audience? Present a stakeholder analysis in order to help your stakeholders’ interests, potential risks and misunderstandings, the mechanisms which can positively influence your stakeholders, the key individuals you should inform about a particular project or projects in general, and the negative stakeholders who may have an adverse effect on a particular project or future projects. Resist the urge to include too much text on your stakeholder analysis slides. You want to provide the very basics so your audience has a visual reference. However, you don’t want to overwhelm your audience with reading material. Walls of text are hard to remember, and using graphics allows you to break away from this boring habit.
Explain Primary, Secondary, and Tertiary Stakeholders Distribution
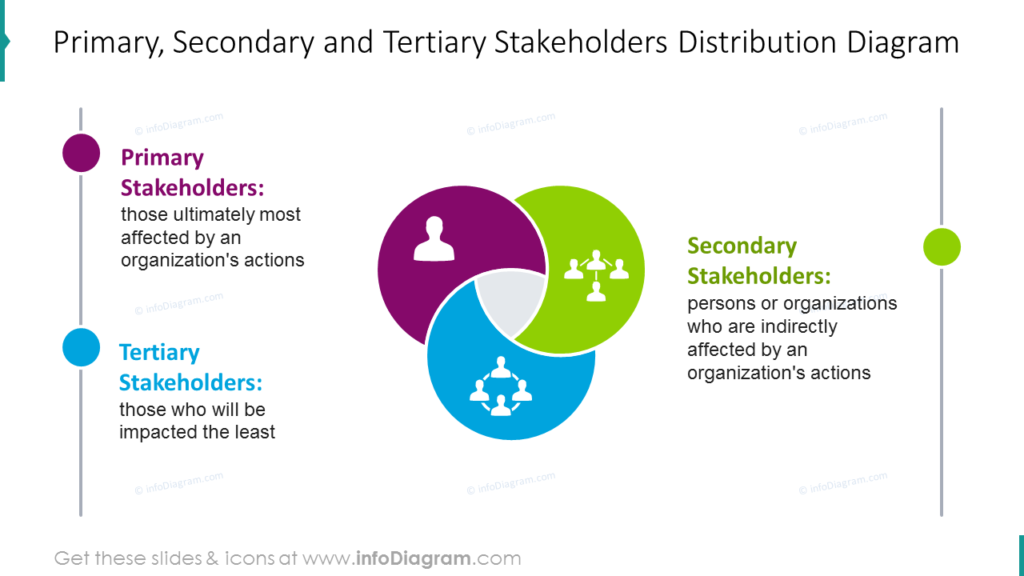
Not all stakeholders are created equal. There are generally stakeholders who are significantly affected by the actions of an organization. Then there are secondary and tertiary stakeholders who are less affected. If you need to break down how the different levels of stakeholders should factor into decisions made by your organization, describing how severe the effect on them will be will help your audience understand the significance.
Take a company-centric approach with an Onion Diagram
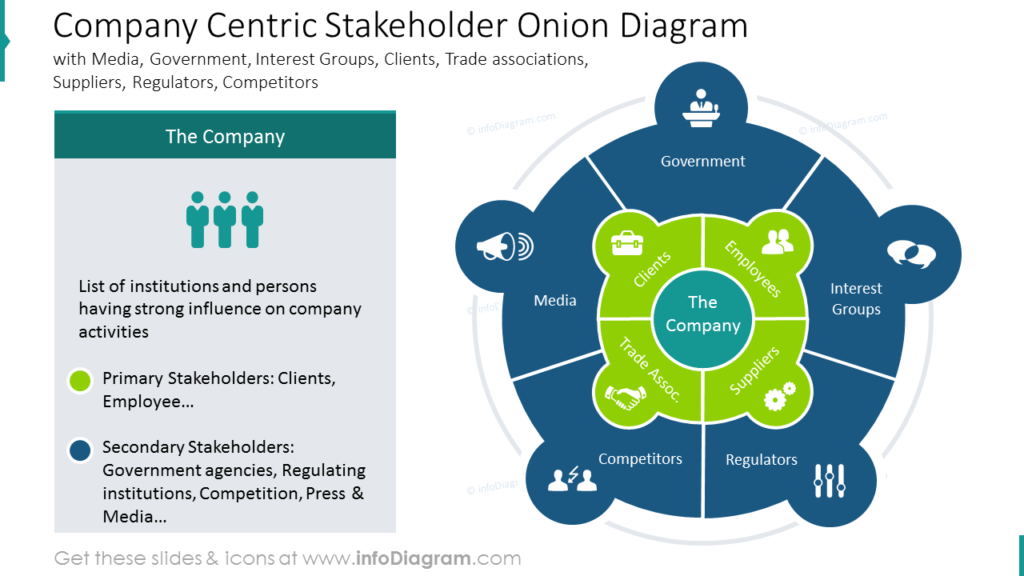
This onion diagram explains the input and influence of stakeholders and your community in a way that puts the company and its needs at the center. You can provide supplementary information in the description box and use it as a legend to explain the color coding. Customize the diagram with relevant icons that are symbolic of the different elements.
Use beautiful stakeholder analysis graphics to articulate your thoughts
There are even more templates than the ones used here. You can use the diagrams in the set to break down who the stakeholders are for a myriad of scenarios. Whether you need to explain franchise, society, government, or other stakeholders there’s no reason to rely on boring tables or lengthy text descriptions.
For more inspiration, subscribe to our YouTube channel:
Resource: Stakeholder Analysis Diagrams
Simple, user-friendly graphics are perfect for helping acclimate your presentation audience to the ideas you need to share. Unlike text-filled tables or visuals you might create yourself with smart shapes, these slide templates are eye-catching and effective. Explain full ideas with the combination of your visuals and your speech.
It’s not just a matter of creating beautiful graphics. It’s also important they be clear. Click here to see the full graphics set:
If you need additional graphics to better customize your presentation, consider checking out our new ultimate infographics collection.


