Use Chemical Lab Graphics for a Unique Presentation
Being creative in business is essential. Whether you’re coming up with the latest big marketing idea to sell your products or services or putting together an engaging presentation about your performance in the latest quarter, it’s important to think outside the box. Visual metaphors are powerful tools that allow you to do something different, but still, help your audience understand your message. You can use chemical lab graphics and test tube diagrams as a metaphor regardless of what your industry is.
How can you use Chemical Lab Graphics and Test Tube Diagrams?
Although chemical lab equipment is an obvious shorthand for science, it can be used to represent processes or progress. You can also use test tube diagrams to embellish a list slide or make any presentation look more professional.
Do you want to present the steps to building a business plan? You can incorporate Chemical Lab Test Tube PPT Diagrams in your next presentation on any other topic.
Make Your Lists Cohesive with Chemical Lab Graphics
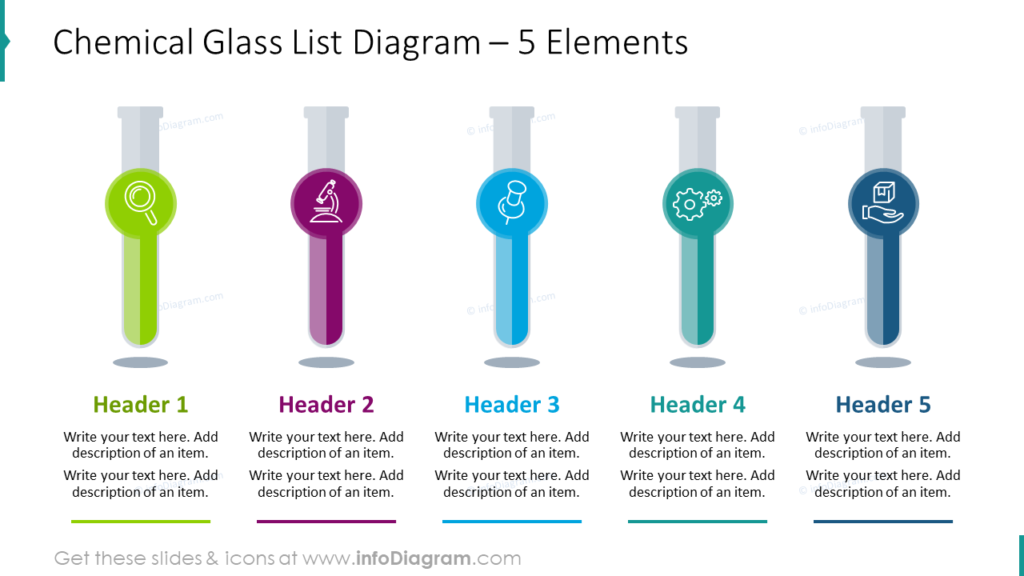
This example slide is definitely more interesting than a plain old bulleted list! Boring, default graphics can’t compete with vibrant, modern diagrams. Give each item on your list color and icon to represent it. You can use the header of each test tube to label each item and provide supplementary details in the description box. If you want to minimize the amount of text which appears on each slide, consider just using the headers as on-slide labels and provide supplementary details in your presentation.
Use Volume to Represent Progress
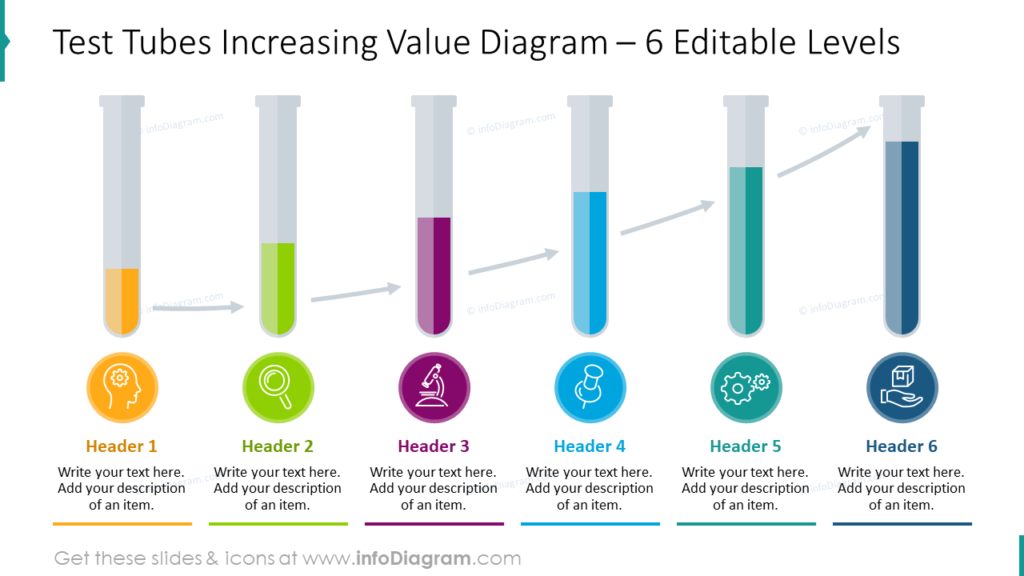
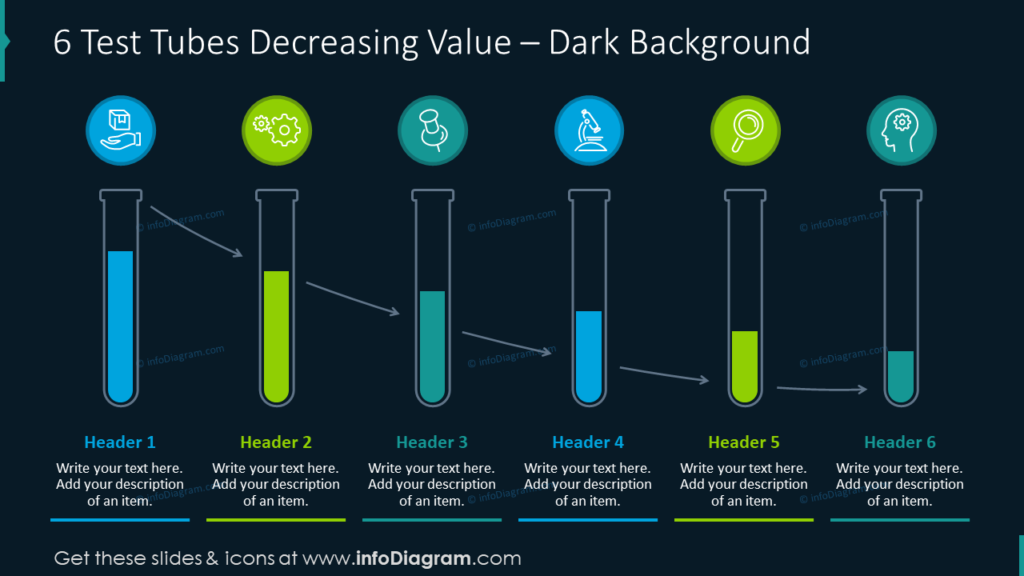
If you have to present or explain a process or progression, chemical lab graphics featuring test tubes are great visual metaphors. The increasing (or decreasing, if you re-arrange the diagrams) can be used to represent progress. Each tube is a symbol for a step or stage. In the example, the different test tubes are different colors as well as have an icon to symbolize their role. If you prefer, you could use the same color or a gradient of similar colors to better represent one process. The choice is yours! You can customize each icon to suit what will best help your audience.
Explain Your Business Plan or How to Develop One
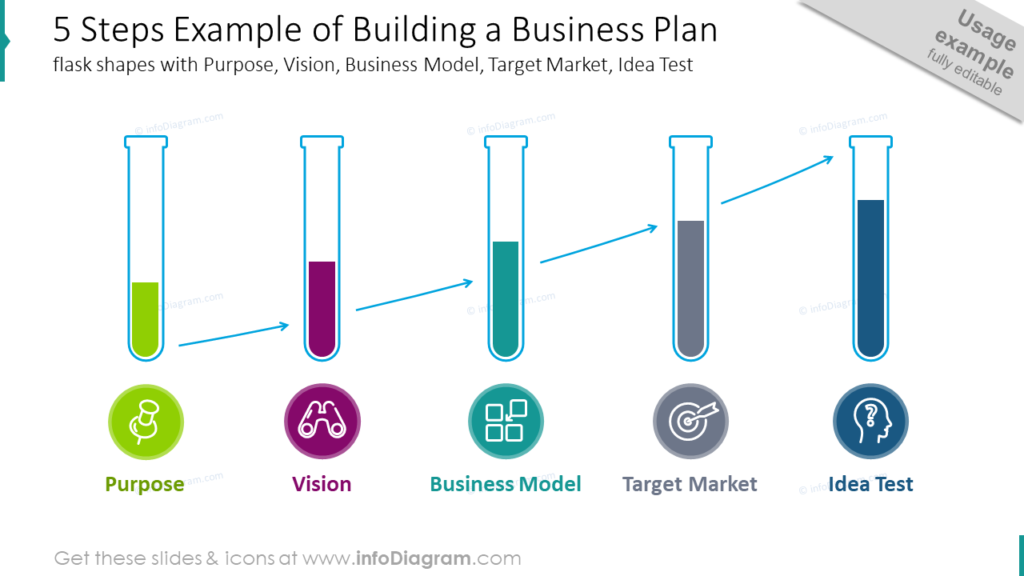
Chemical lab graphics, specifically test tube diagrams with different tube volumes are a great way to explain a business plan. Building a business, or even building a plan for a business, are large, abstract concepts. Explaining large or abstract concepts is easier to follow when you incorporate a visual metaphor. The same logic which allows you to explain processes with chemical lab test tubes allows you to break building a business plan into easy to conceptualize chunks.
Use More Chemical Lab Graphics
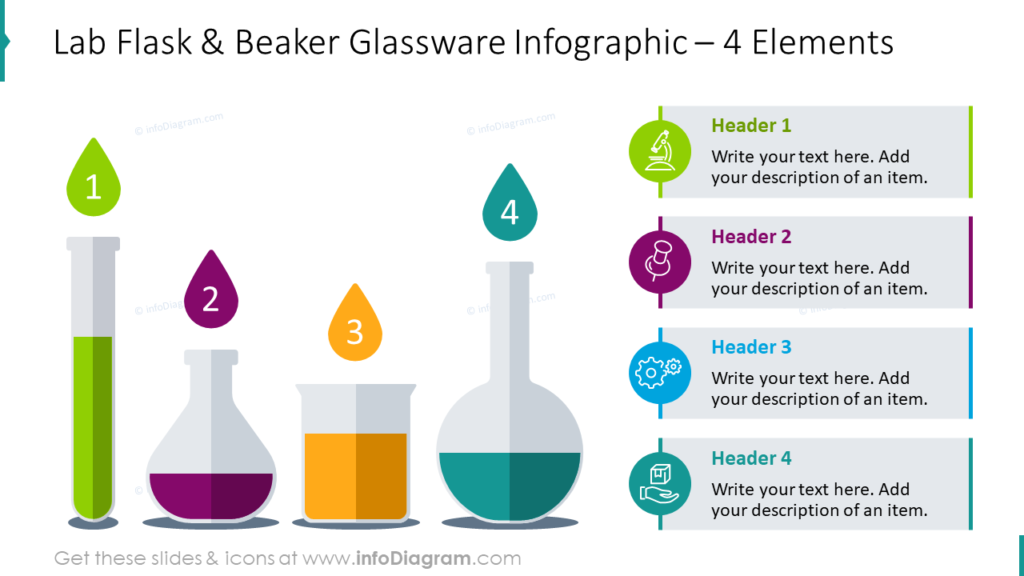
Chemical labs use more than just test tubes! Instead of relying entirely on test tubes, think about how you might incorporate other equipment. In this example, each piece of glassware represents something different. The colors of the liquid inside can be changed to represent each item you need to explain. You can select a relevant icon to represent each one in the sidebar and provide relevant headers and descriptions so your audience is more likely to understand what you’re trying to explain.
Pipettes are Impactful Chemical Lab Graphics
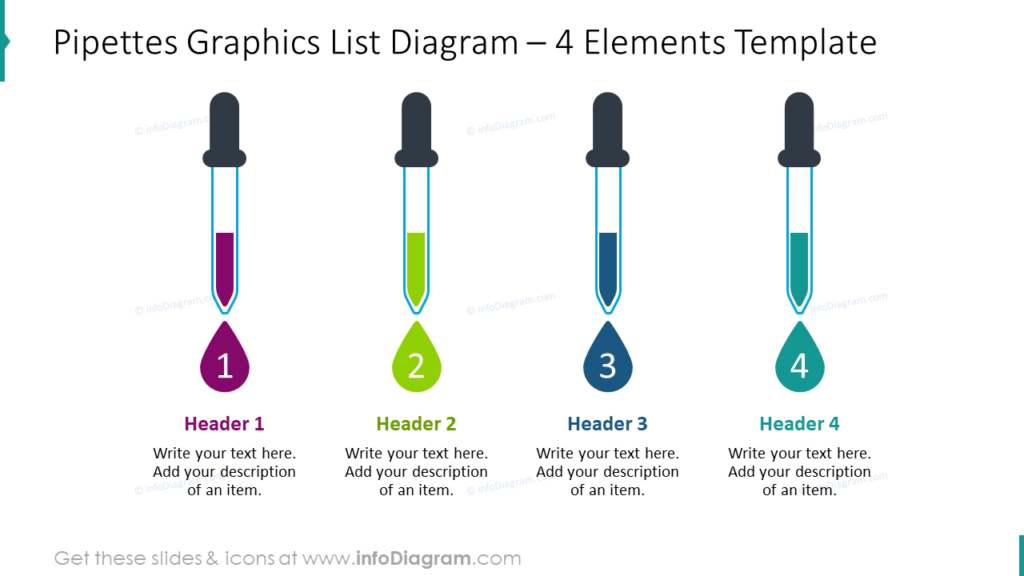
Not every chemical lab graphic is a glass vial. Pipettes or eye droppers are also chemical lab equipment. You can use them instead of standard bullets for a list or use differing fill levels to represent a process or varying quantity. The possibilities are endless! Just be sure to customize both the colors and fill level to help your audience understand.
Not Sure if Chemical Lab Graphics Will Suit Your Presentation?
Do you need to present items that can be organized in a list? Are you sharing data that can be divided into categories? Do you want to use user-friendly, engaging graphics? If the answers to these questions are yes, you might benefit from chemical lab graphics. Test tubes, beakers, and experiments are all creative visuals. Using them as metaphors for which can apply to virtually any industry.
Resource: Chemical Lab Test Tube Graphics
Shift away from boring tables, bullet lists and stale clip art. Use visually appealing, unique graphics to keep your audience interested. Communicating full ideas with just a few icons will allow you to share a variety of information without being overwhelming. Your audience will understand and retain your message if you can minimize the amount of dense text you include in your presentation.
Beautiful, understandable graphics are essential for putting ideas together. See the full set by clicking here:
If you’d like to customize your presentation further, consider our fresh collection of professionally-designed infographics templates. Those diagrams will help to make your next presentation even more unique.


