Go-To-Market Strategy Presentation: 10 PowerPoint Slide Ideas [GTM Plan]
Create a compelling go-to-market strategy presentation in PowerPoint. See 10 slide ideas for GTM plans, market entry, and launch strategy with editable templates.
Are you presenting an action plan that outlines the necessary steps to succeed in a new market? If you need to convince the management board, investors, or other stakeholders, to enter the new marketplace, having a concisely presented go-to-market strategy can help a lot.
Below we present several ideas for visual slides covering new market strategies, including:
- country macroeconomic snapshot
- market size comparison
- financial highlights of specific market
- potential partners evaluation
- timeline of a rollout to the new marketplace
- PESTLE analysis with instructions on how you can create fresh-looking PESTLE analysis slides using simple design tricks.
We hope our examples will help you stop wasting time on figuring out how to present a certain strategy and allow you to focus on the content.
All slide examples below can be downloaded as an editable source. See the full Go To Market Strategy PPT Plan graphics collection for PowerPoint.
What is a Go-to-Market Strategy?
A GTM strategy is a tactical action plan that outlines the steps necessary to succeed in a new market or with a new customer. It can be applied to almost anything, from launching new products and services to re-launching your company or brand or even moving a current product into a new market.
Get inspired by 10 slide examples of how you can showcase the various aspects of your go-to-market plan. You’ll also find an instruction on how you can create fresh-looking PESTLE analysis slide using simple design tricks.
Present all elements of go-to-market strategy to show the big picture
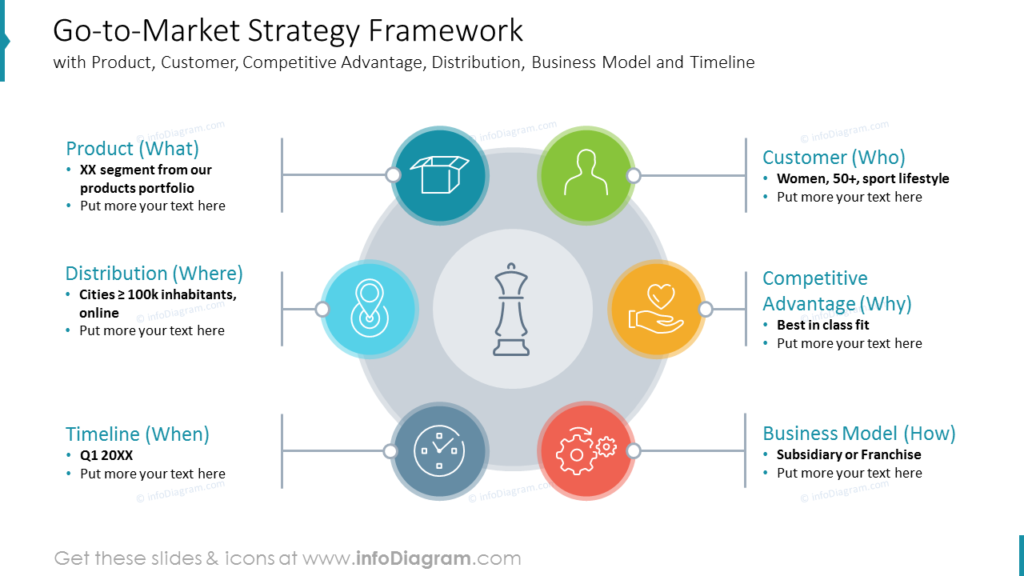
Such a framework presenting all important elements of your go-to-market strategy on one slide will help to analyze the situation.
You can list the common elements such as:
- Product (What you offer),
- Customer (Who is your client),
- Competitive Advantage (Why client should care),
- Distribution (Where your product will be available),
- Business Model (How it will all work),
- Timeline (When the plan will happen).
Notice how headers and bold text make the info more structured, and an icon of a chess figure gives an idea of what you’ll be discussing right away.
Show market macroeconomics
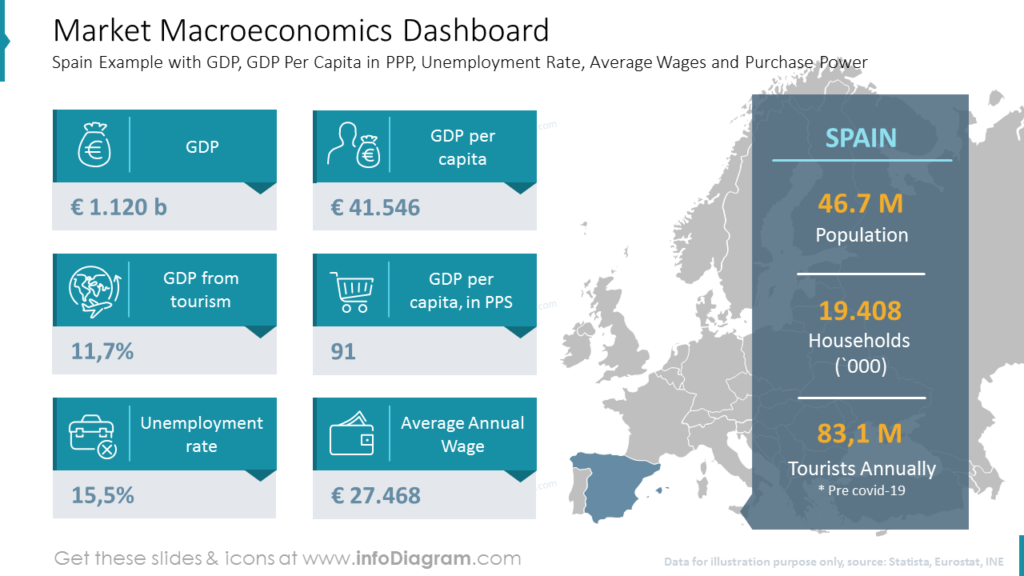
This slide example shows how you can arrange macroeconomic indexes in a clean dashboard. Numbers on the right on the map background focus on the most essential indicators, like Population, Households, and Tourists Annually, and the figures on the left go deeper.
If you want to add a map to your report, see more ideas on preparing professional-looking map slides.
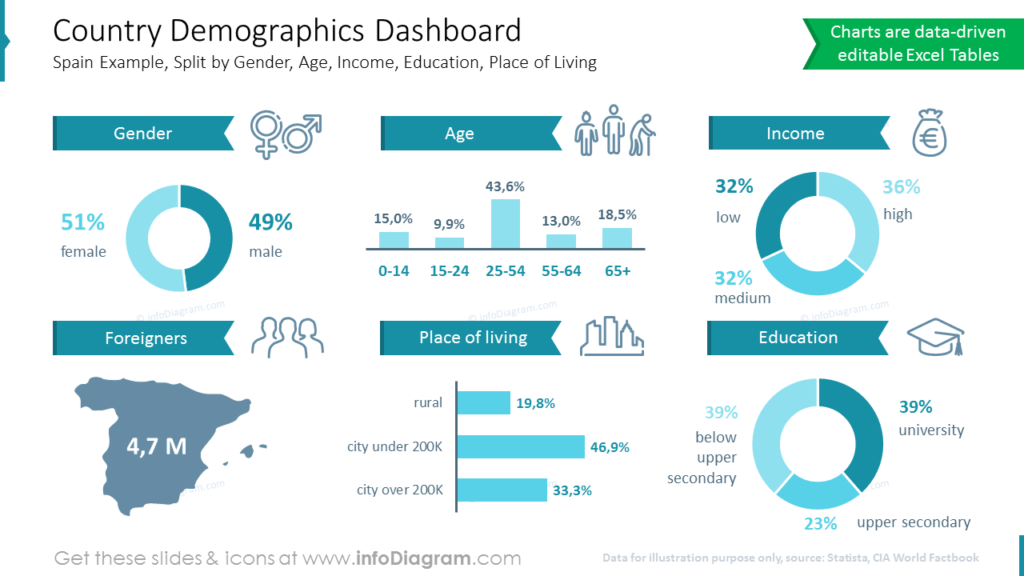
To present a split by Gender, Age, Income, Education, or Place of Living, you can use such country demographics dashboard, which focuses only on indicators connected with population. Use buyer persona graphics to describe your best customer profile and target client.
Visualize market comparison
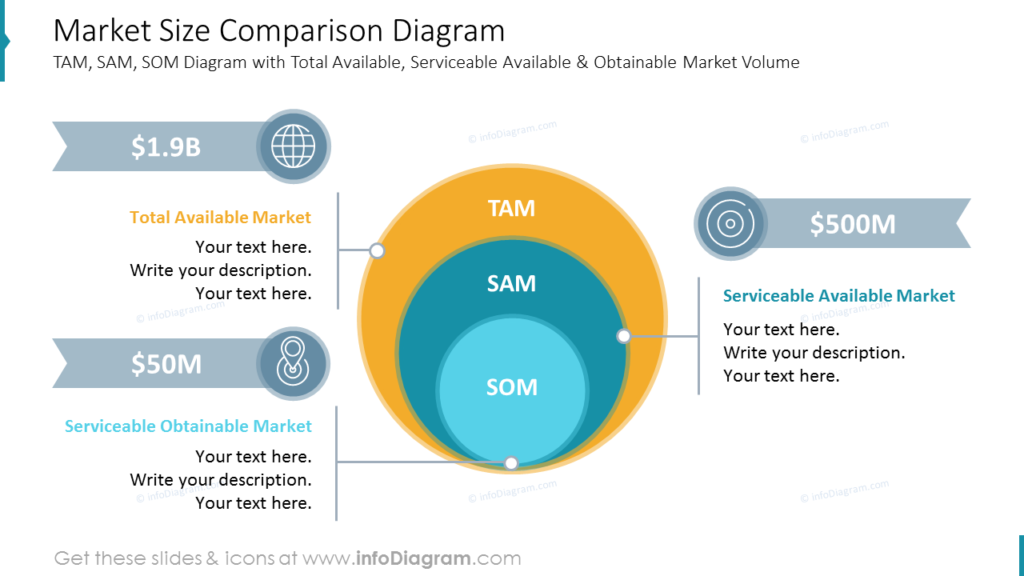
In the diagram above we illustrated the total available, serviceable available & obtainable market volume. Such a slide looks more attractive rather than a simple bar chart.
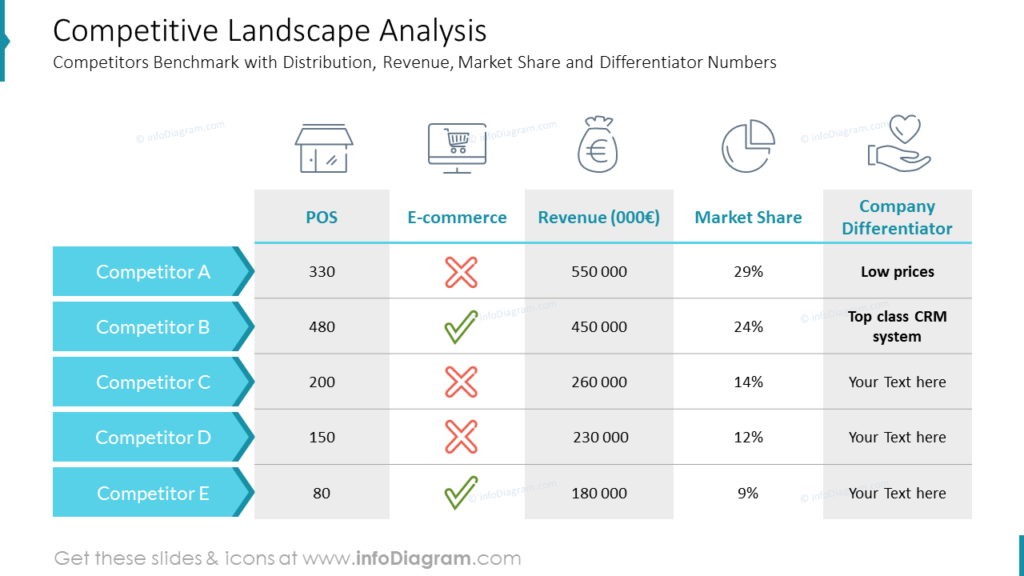
If you’d like to present competitors’ comparisons in a more detailed way, see the above example of the competitive landscape analysis table.
Illustrate financial highlights
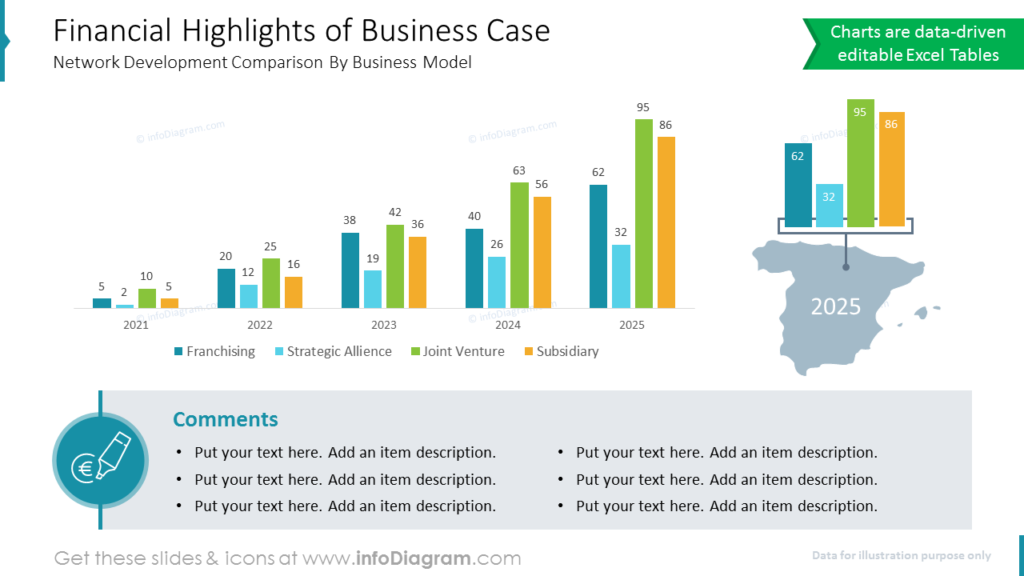
Financial information can be hard to digest, especially by non-financial audiences. To present financial highlights of your business case benchmarking network development, revenue, and profitability, you can apply the timeline of 5 years (or as many as you need).
Notice the color-coding of each indicator, which makes the whole chart easier to read. You can also include comments at the bottom of the slide so as not to steal attention from the main content.
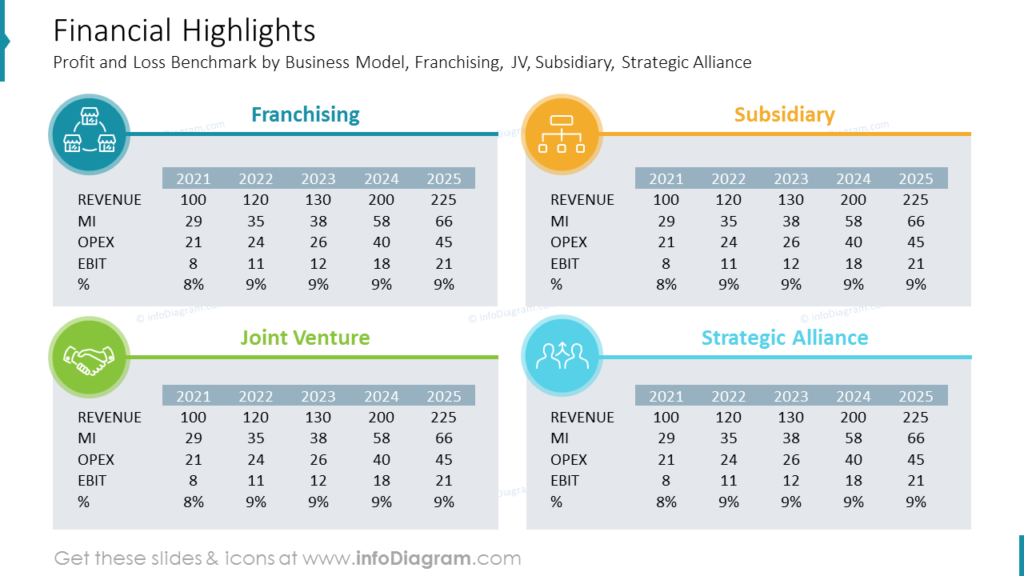
If you want to focus on each index separately, you can try using such a slide with four smaller tables.
Outline preferred partners in go-to-market strategy presentation
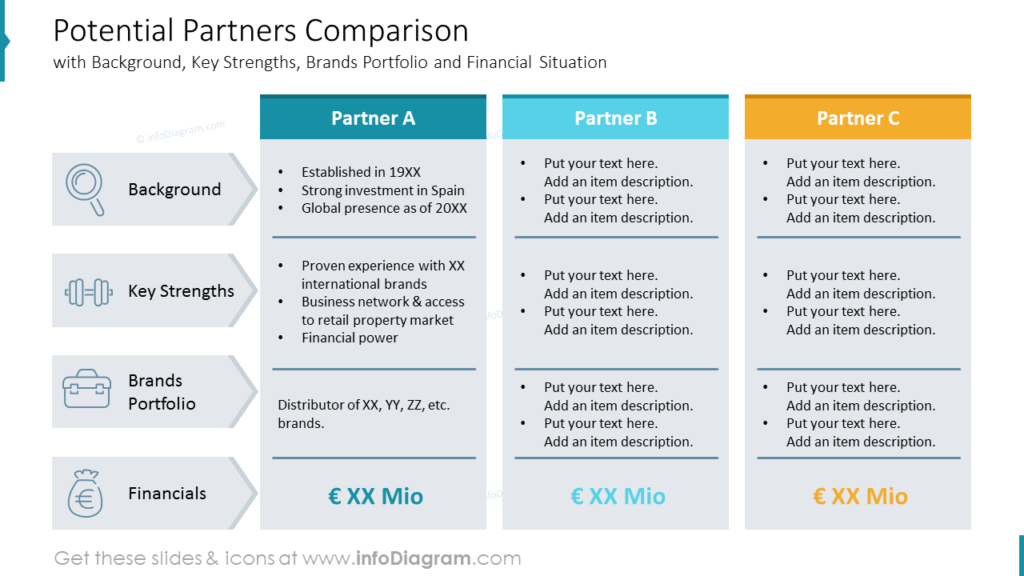
Most tables contain a lot of information and numbers and become very heavy and not readable. Simple design elements and tricks, like thin lines, color coding, and illustrative icons can help make your slide look professional and clear.
On the example slide, you can see the comparison of three potential partners by the following parameters: Background, Key Strengths, Brand Portfolio, and Financial Situation.
Present timeline of a rollout to the new marketplace
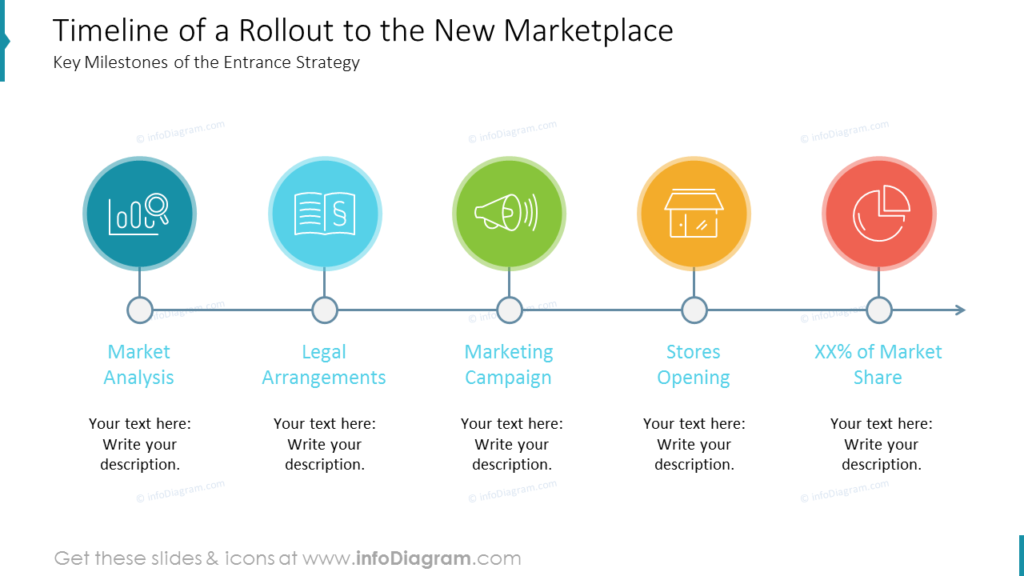
Illustrate the product introduction by a 5-step timeline: Market Analysis, Legal Arrangements, Marketing Campaign, Store Opening, and % of Market Share. We also added symbols to each key milestone.
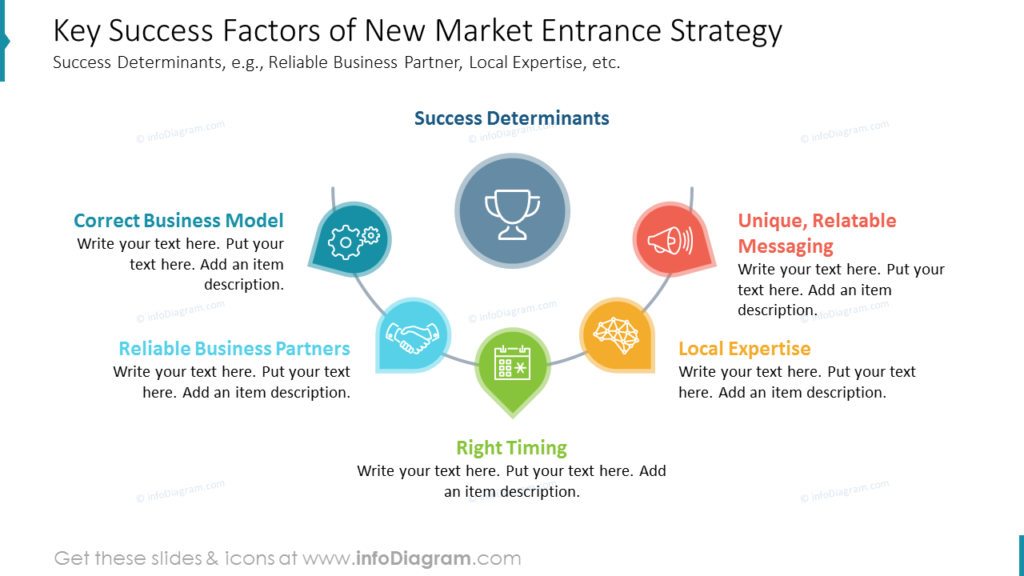
You can also mention key success factors of the new market entrance strategy using a diagram with success determinants. As an example, we outlined the following factors: Correct Business Model, Reliable Business Partner, Local Expertise, Right Timing, and Relatable Messaging.
Step-by-step instruction on how to redesign PESTLE analysis into a modern table
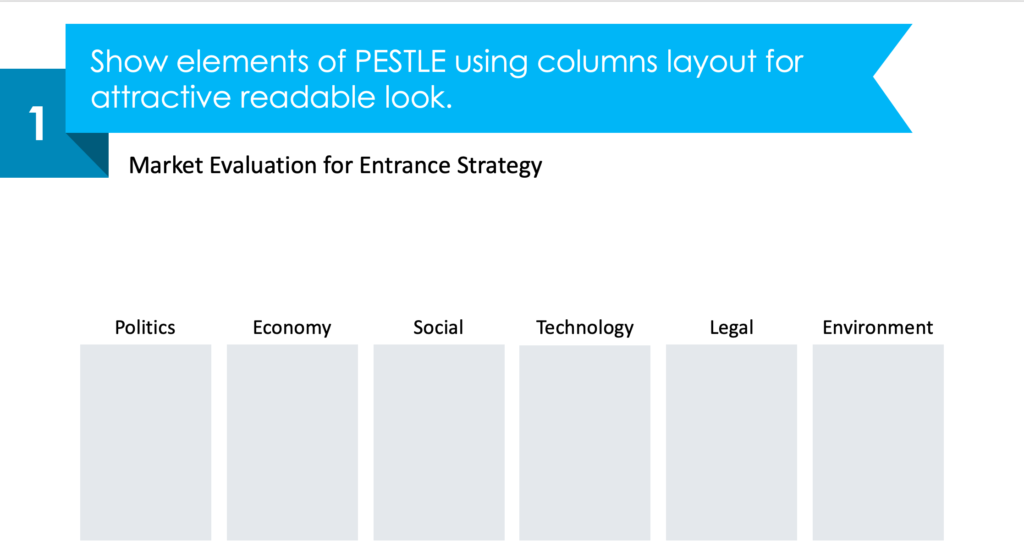
Usually, PESTLE analysis is presented as a simple bullet-point list or default table in the best case. Enjoy a quick guide on how you can create an innovative PESTLE analysis slide using simple shapes, icons, and a few tricks that will save you time.
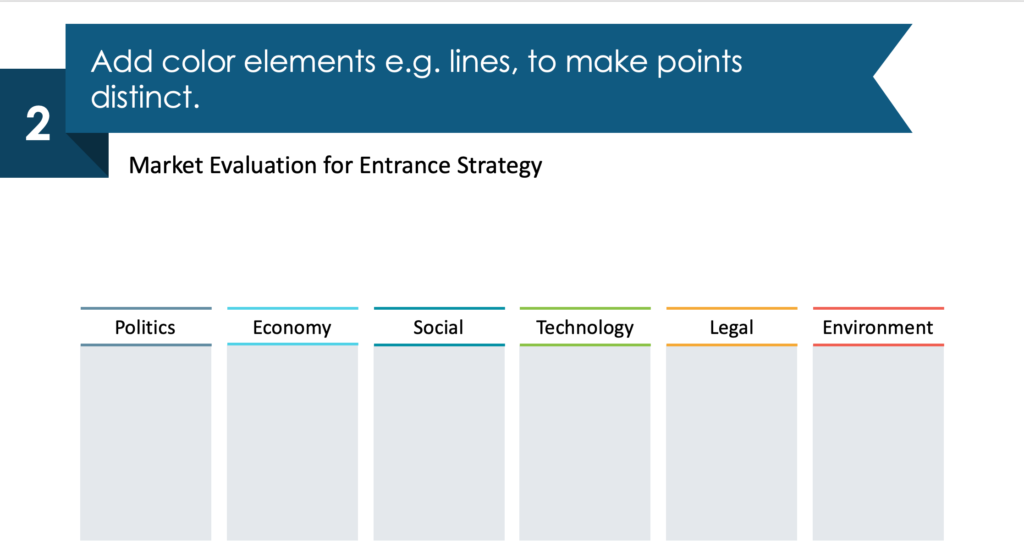
1. Show elements of PESTLE using a columns layout for an attractive readable look.
2. Add color elements e.g. lines, to make points distinct.
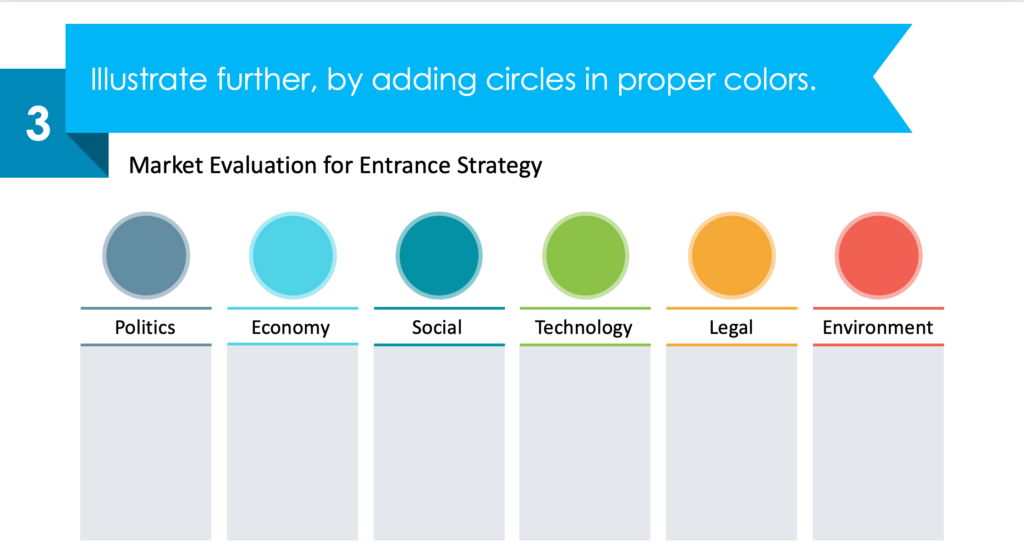
3. Add circles in the proper colors.
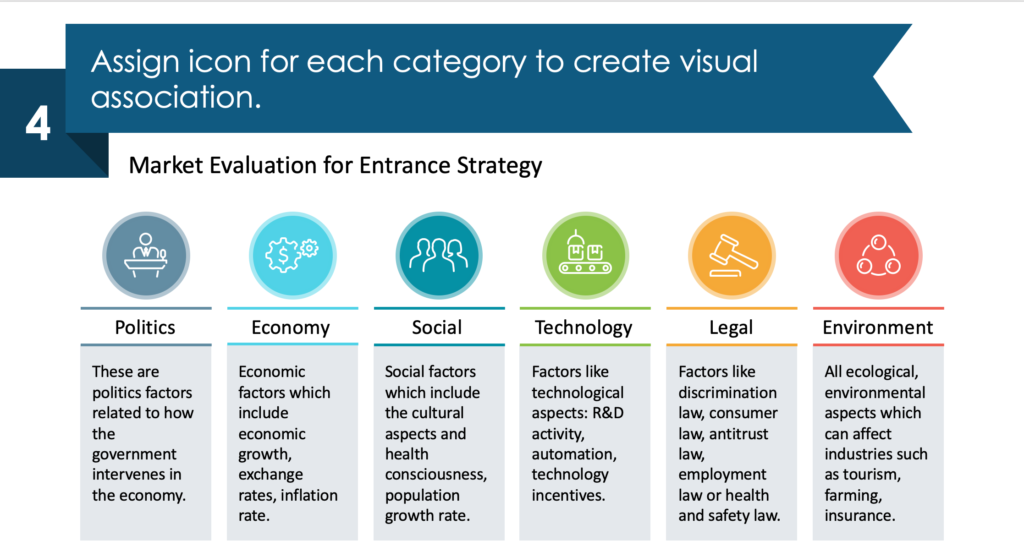
4. Assign icons for each category to create a visual association.
See the whole instruction and other visual examples on our YouTube channel.
Here is also this blog summary in a video:
If you are looking for inspiration on presenting client profiles, goals and general vision, product strategy, and more check our marketing strategy plan visualization ideas.
Resource: Go To Market Strategy PPT Plan Infographics
The diagrams and graphics in this blog are a part of our go-to-market strategy plan deck. It contains templates to illustrate the strategy framework, market evaluation, dashboards, competitive analysis, financial highlights, and more.
See the full deck here:
If you need more general diagrams, consider the ultimate collection of infographic templates.
Subscribe to the newsletter and follow our YouTube channel to get more design tips and slide inspiration.