10 Infographic Ideas for Post-Pandemic Business Recovery Plan Presentation
Coronavirus pandemic has significantly impacted all spheres of our lives. Economies, education, healthcare, business have all been affected by its consequences. If you are working on a post-pandemic business recovery plan, check this blog with examples on how to present crisis management in a clear, informative, and visually appealing manner.
The business Recovery Plan discussed in this blog is a 3 stages strategy on how to deal with a sudden emergency situation, causing massive business disruption. It includes ideas on how to adapt to new business contexts, customers behaviors, new market dynamics, and ultimately how to reshape the ways of working for the future through reorganizing and building flexibility into business models being open to evolving world.
In this blog, we share 10 infographics examples of how to visually present a business recovery plan and transformation strategy. In the end, you can also find a 4-steps instruction on creating a diagram illustrating a business reaction process.
All graphic examples presented below can be downloaded as an editable source. Check out the Post Pandemic Business Recovery Plan for PowerPoint.
Explain phases of business reaction
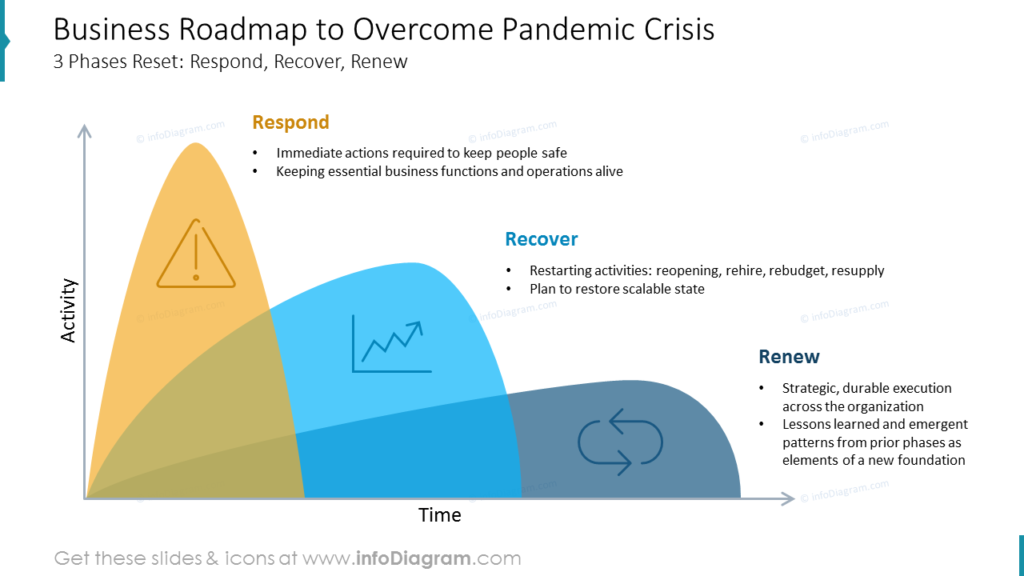
The example roadmap diagram shows three phases to overcome the pandemic crisis: Respond, Recover, and Renew. Notice how color coding is used to outline each stage, and how they overlap with each other.
You can use the white space on the same slide to make short notes, e.g. to show what actions are included in every phase:
- Respond
- Immediate actions, required to keep people safe
- Keeping essential business functions and operations alive
- Recover
- Restarting activities: reopening, rehire, rebudget, resupply
- Plan to restore scalable state
- Renew
- Strategic, durable execution across the organization
- Lessons learned and emergent patterns from prior phases as elements of a new foundation
Illustrate your performance gap analysis
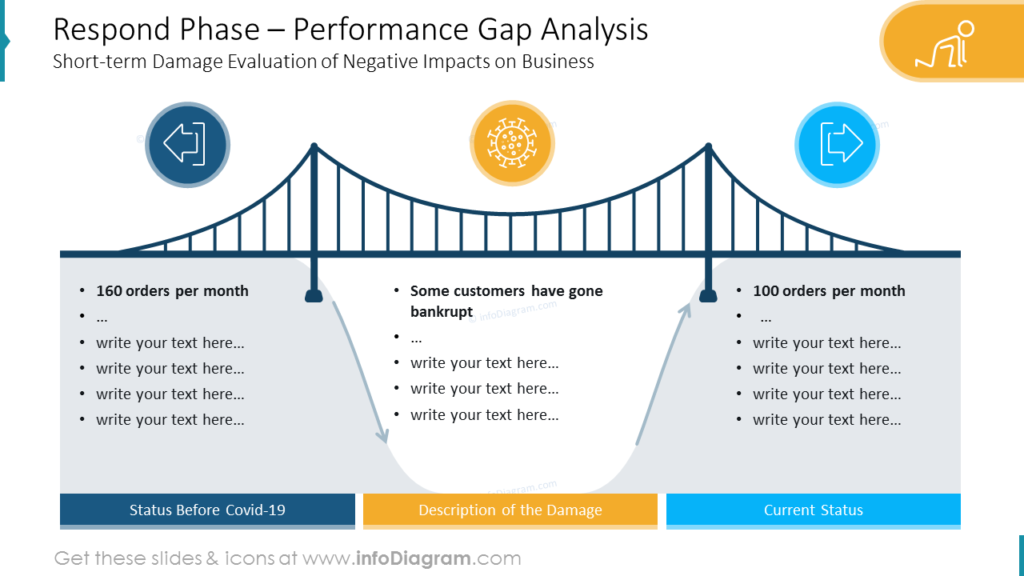
The bridge is an excellent metaphor if you want to explain gap analysis and damage evaluation of negative impacts on business. To underline each of the three milestones, you can use icons: Status Before Covid-19, Description of the Damage, and Current Status.
If you’d like to focus on bridging the gap concept, connecting past and present, check our bridge & gap diagram collection.
Present contingency plan for respond phase
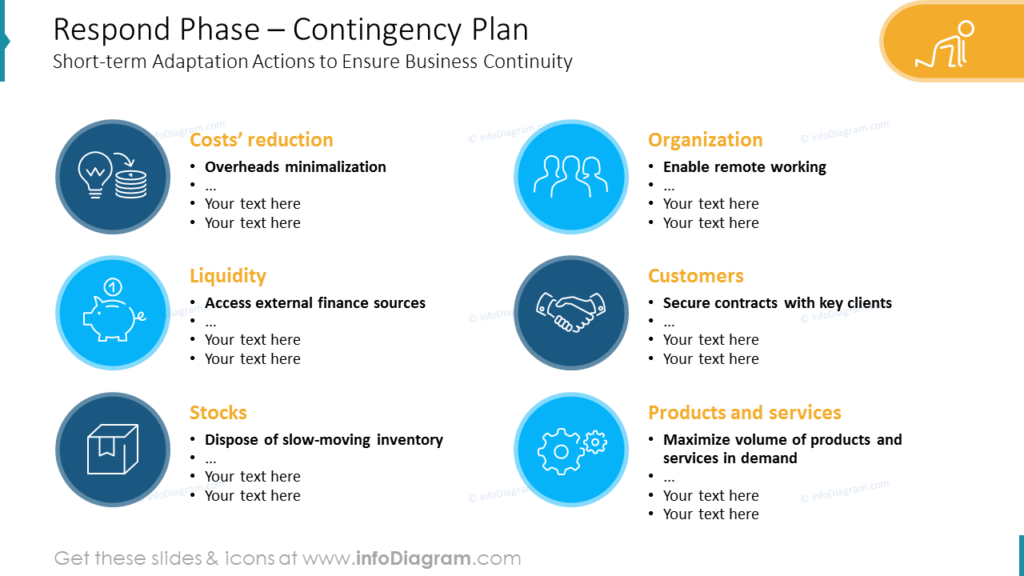
A contingency plan includes adaptation actions to ensure business continuity. In this example, you can see how we showed six measures with icons and put the most essential point for each action in bold. The example contingency plan incorporates the following elements: Costs reduction, Liquidity, Stocks, Organization, Customers, Products, and services.
Show digital transformation areas as a clear visual diagram
“The digital revolution is far more significant than the invention of writing or even of printing.” – Douglas Engelbart
Indeed, companies will need to adapt to the new normal by transforming business models and operations. According to the McKinsey Global Survey, most respondents recognize technology’s strategic importance as a critical component of the business, not just a source of cost efficiencies.
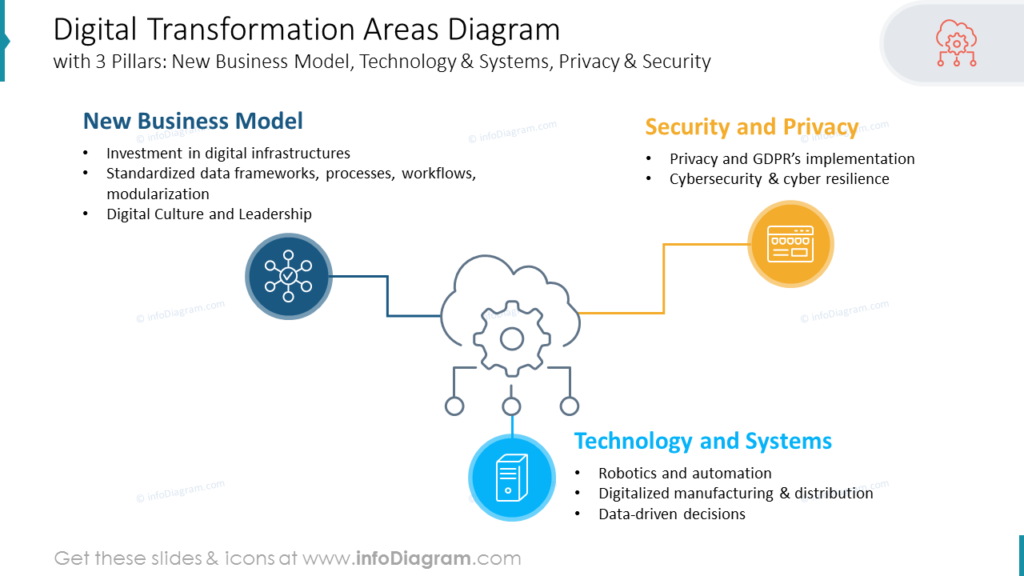
Illustrate such transformation and automatization clearly using a simple 3-component diagram with an icon in the center: New Business Model, Technology & Systems, Privacy & Security.
Would like to focus on digital transformation more? Use the following diagrams:
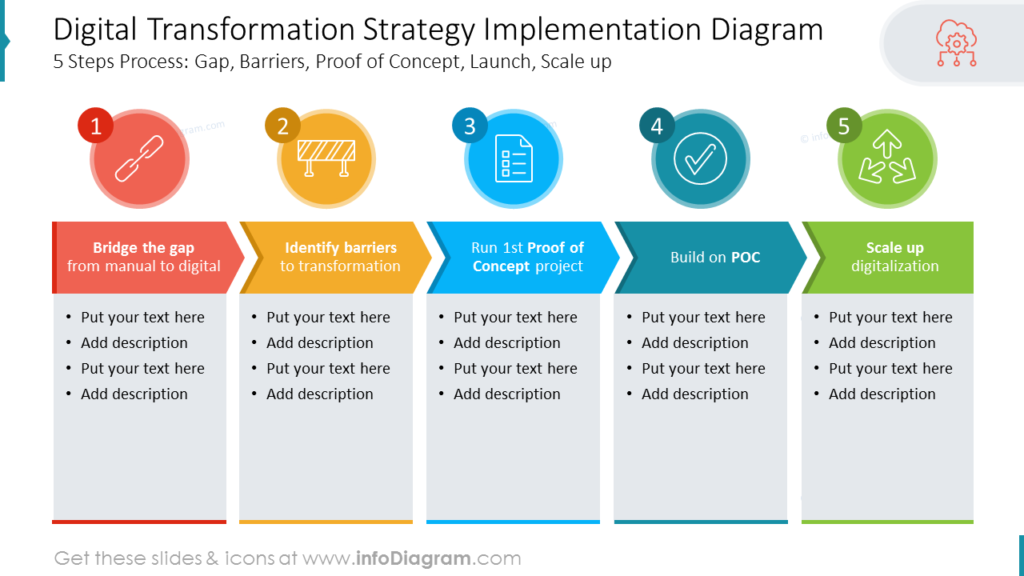
- five-step strategy implementation diagram: Gap, Barriers, Proof of Concept, Launch, Scale up
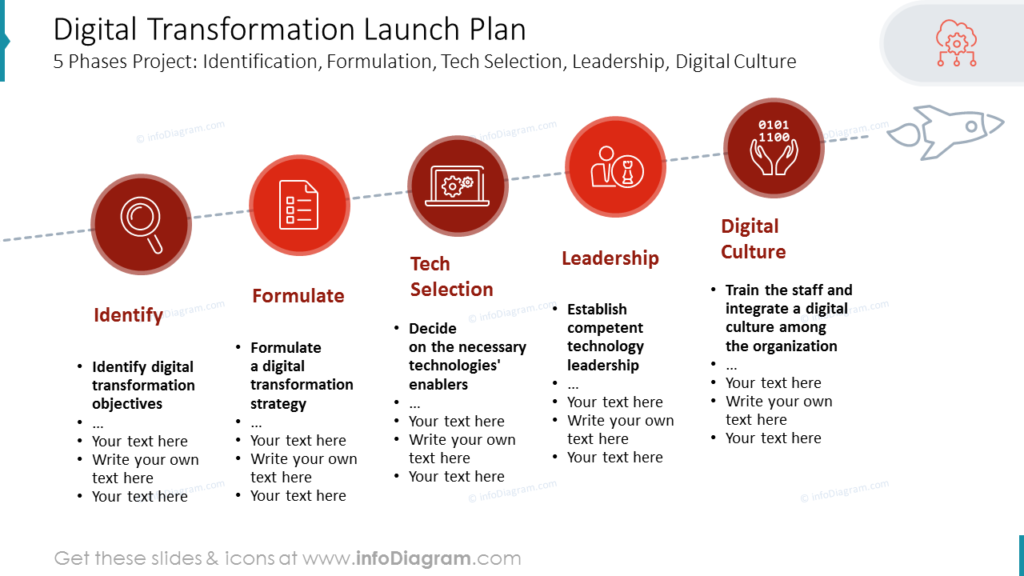
- launch plan, which includes Identification, Formulation, Tech Selection, Leadership, Digital Culture.
If digital transformation is the main topic of your presentation, and you’ll be discussing the social and business effects of digitalization, have a look at our digital transformation strategy roadmaps collection.
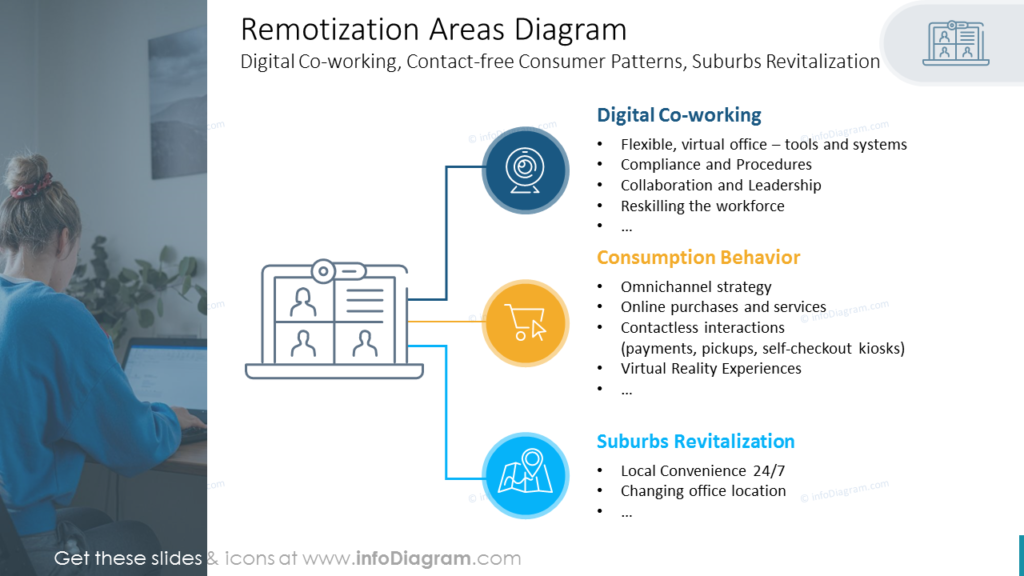
Explain remotization areas relevant for your business recovery plan
The world is moving towards a remote lifestyle. If you are making alterations in this direction in your company as well, present it clearly to ensure everyone’s on the same page.
You can reuse such a slide with a diagram showing three remotization areas: Digital Co-working, Contact-free Consumer Patterns, and Suburbs Revitalization. Each element is illustrated with an icon and we also added a picture aside, so your listeners can get a sense of what you’ll be discussing right away.
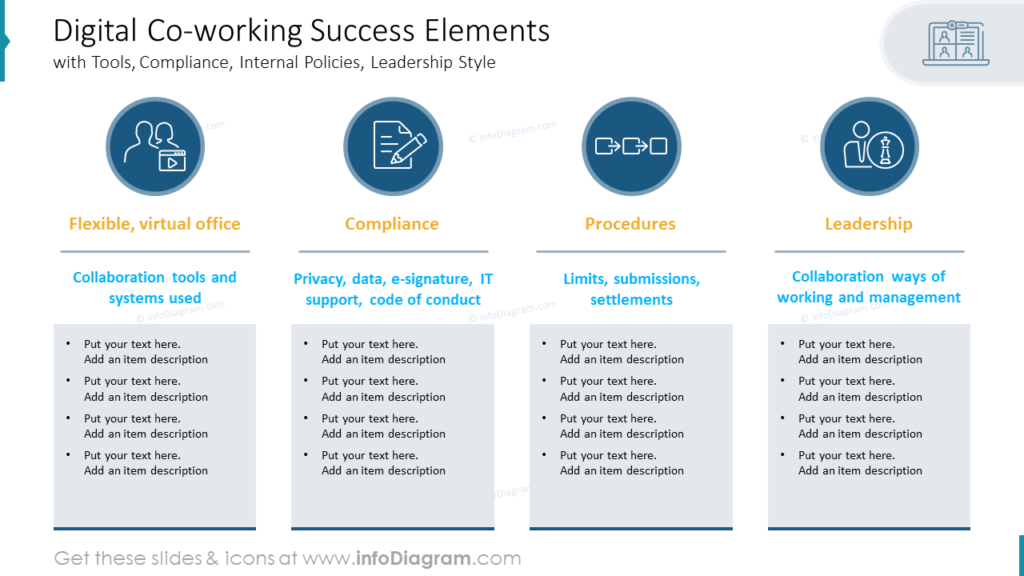
Summarize digital co-working success elements
Work-from-home and telecommuting became insanely widespread since the beginning of the pandemic. Reports from Statista say that 25% of companies will move 10% of their employees to permanent remote positions post-COVID-19, and 2 out of 3 people believe that the traditional office setup will be obsolete by 2030 (according to Zapier Remote Work Report).
If you want to focus on the success elements of digital co-working, have a look at our example infographics: instead of using bullets, we organized information in 4 columns with headers, icons, and a place for notes.
Check more resources for illustrating presentations about remote work know-how, tools, challenges, and processes, or how to show the WFH concept with one icon.
Cover responsibility and sustainability aspects
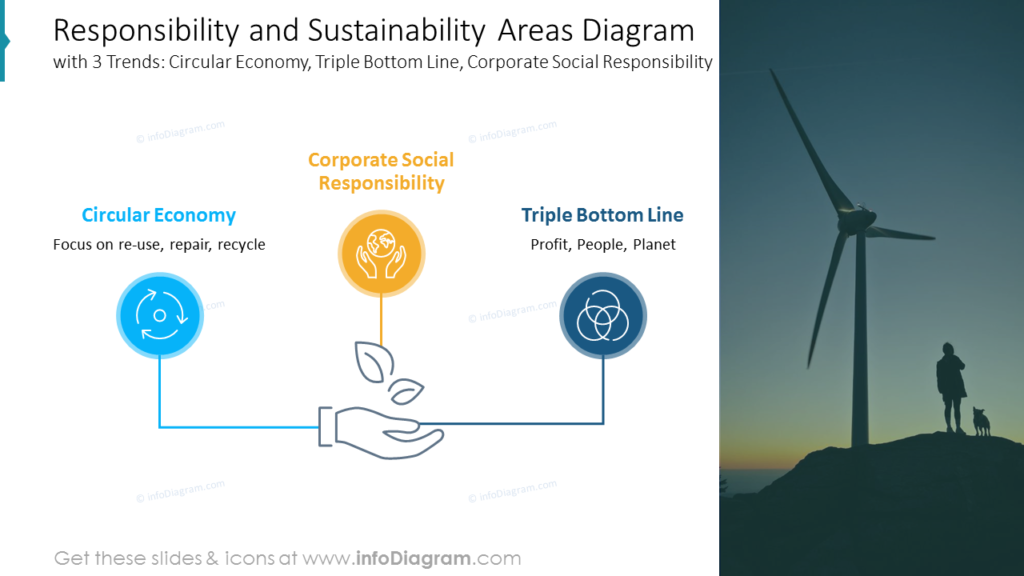
To show your approach to responsibility and sustainability within your business transformation strategy, you can use a 3 elements diagram embracing top trends: circular economy, triple bottom line, corporate social responsibility. Unique outline icons emphasize the sense of each component.
Illustrate circular economy model
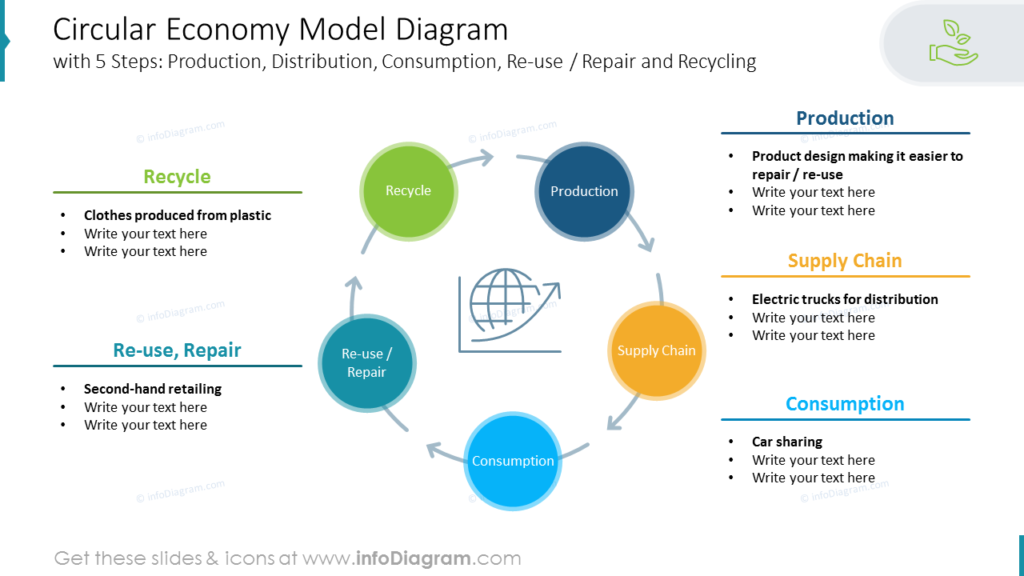
Want to mention the concept of circular economy and how it will impact your strategy? Check our example of 5 steps circular economy model diagram, including Production, Distribution, Consumption, Re-use / Repair, and Recycling.
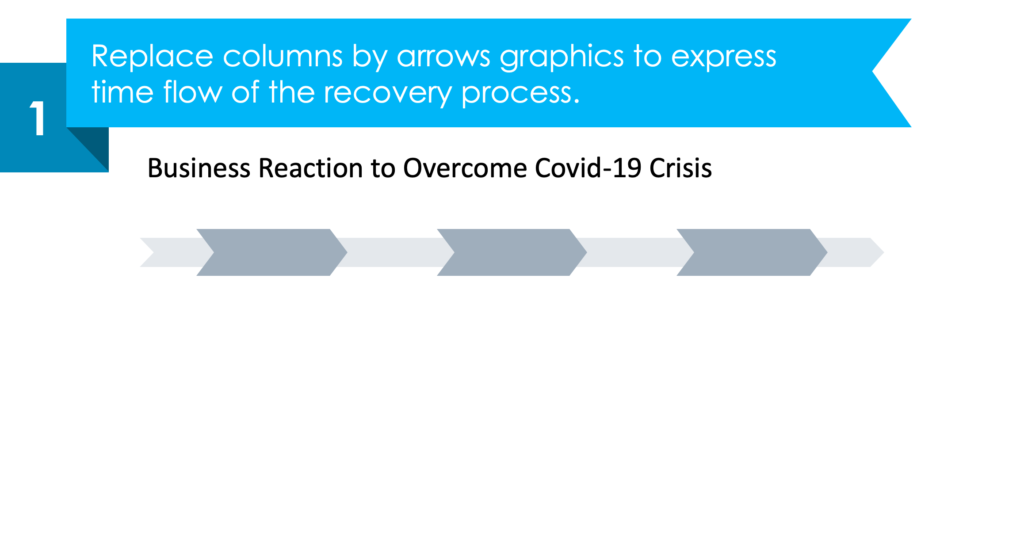
Guide on how to present business recovery process on a slide
Here’s a detailed instruction on how you can show three phases to overcome big market changes or crisis using simple shapes, icons, and ready/steady/go metaphor. It can be changed and adapted for presenting any 3-elements action plans.
1. Replace columns with arrows graphics to express the time flow of the recovery process.
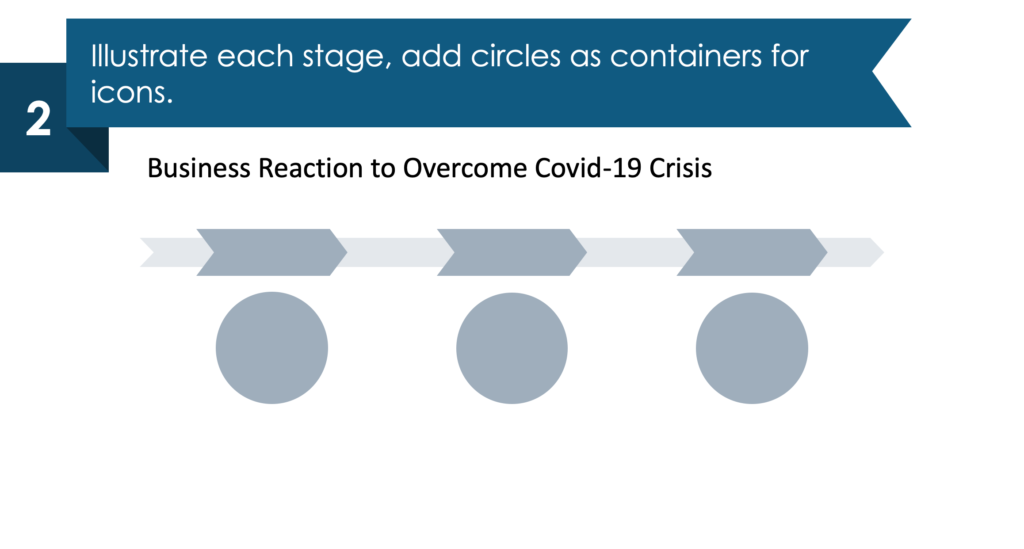
2. Add circles as containers for icons to illustrate each stage.
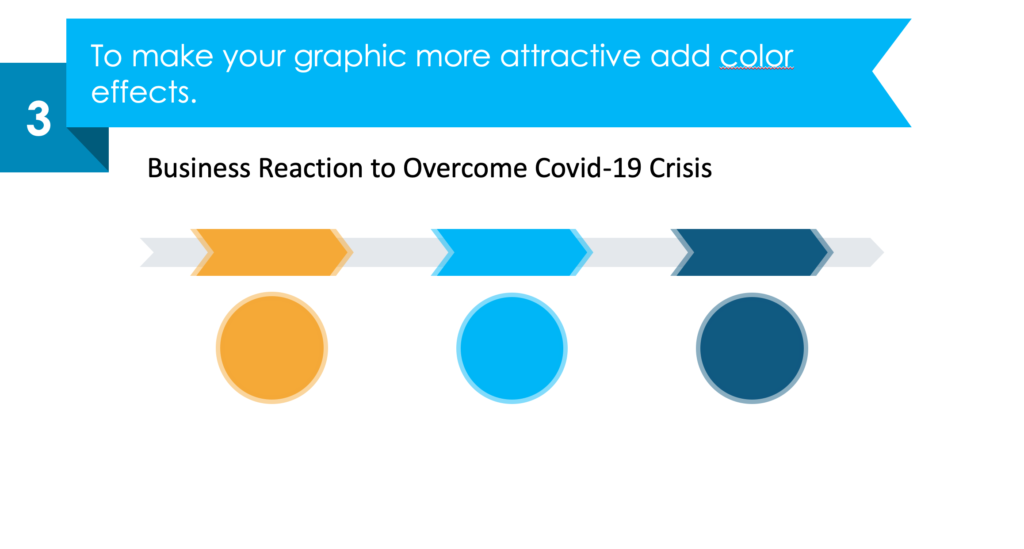
3. To make your graphic more attractive add color effects.
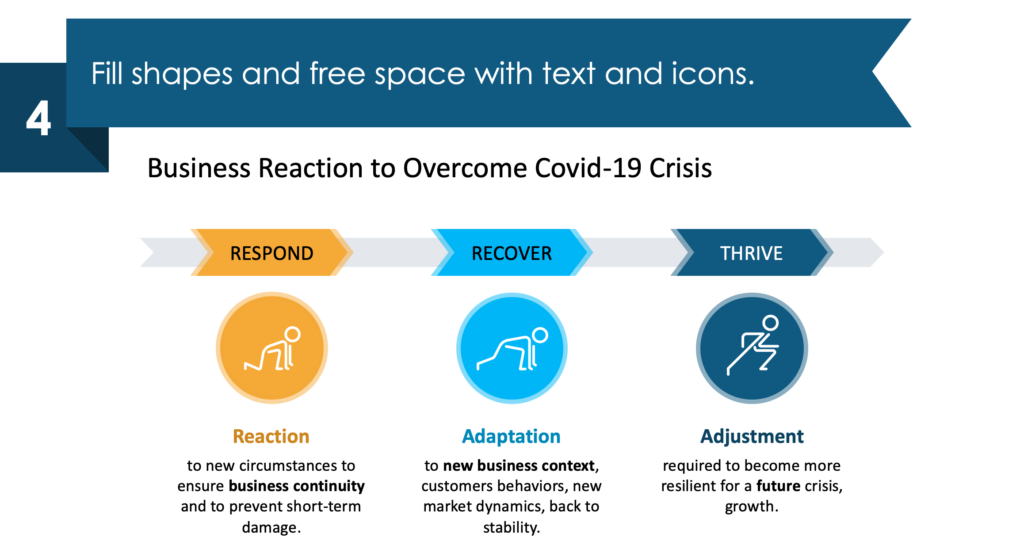
4. Fill shapes and free space with text and icons.
See the whole guide and other examples here: Present Your Post Pandemic Business Recovery Plan Professionally in PowerPoint.
Resource: Business Recovery Plan Template
Presenting your plan on how to cope up with changing trends in the market to your stakeholders? This PowerPoint template presents action steps on overcoming the crisis and highlights key points in a simple and understandable way. You can use these visuals to present the business transformation or change management as well.
See the full template here:
Business Recovery Plan Template includes 32 diagrams and 71 outline icons to illustrate the business roadmap to overcome the post-pandemic crisis, respond, recover and thrive phases, focus areas, and more.
Do you need additional graphics for your next PowerPoint project? See if the graphics in this collection of professionally designed templates can help!


