Gap Analysis Presentation: Types, Tools & Visual PowerPoint Examples
Learn how to present gap analysis clearly in PowerPoint. See visual examples of gap analysis types, tools, and frameworks with editable slide templates.
Looking for ideas to show the bridge between the actual and desired performance? If you need to evaluate current results and the necessary improvement efforts to close the gap and reach the desired performance, check this blog for inspiration and illustration examples of gap analysis findings.
Specifically, you will find ideas on how to present:
- Gap analysis definition
- Expected benefits
- Customer experience gap
- Skills gap comparison
- Gap analysis states and process
- Usage gap breakdown
You can download all presented graphics examples as an editable PowerPoint deck with Gap Analysis Types and Tools PPT diagrams. See details by clicking slide pictures.
What is a Gap Analysis?
Gap analysis is a business assessment methodology. It can be defined as a process that compares actual performance or results with what was expected or desired. The method provides a way to identify suboptimal or missing strategies, structures, capabilities, processes, practices, technologies, or skills, and then recommends steps that will help the company meet its goals.
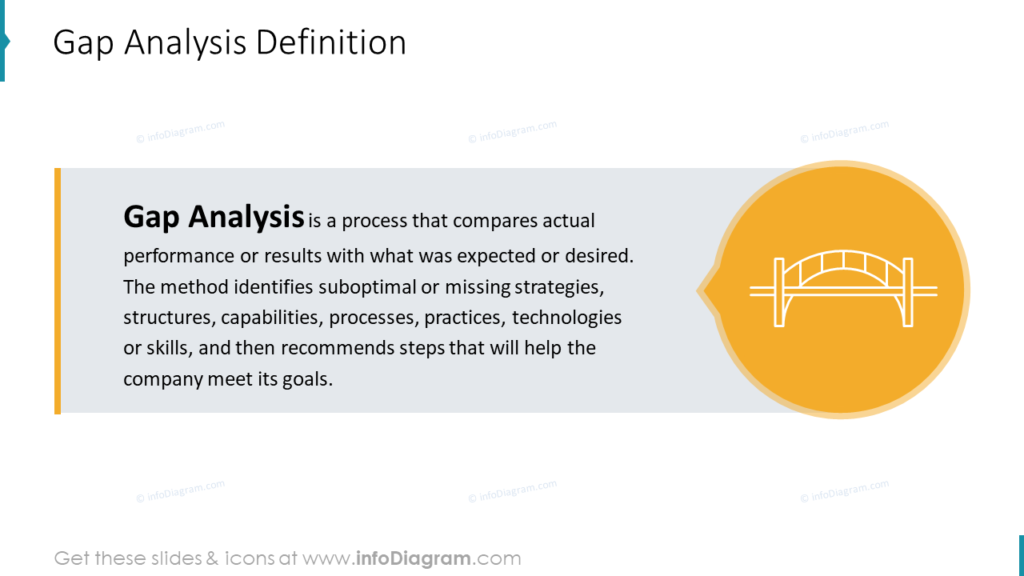
You can present that definition in a visual way like above. Adding there design elements such as an icon of a bridge and a grey background for the textbox will make the slide more fresh and appealing to look at.
Present expected benefits
The benefits of gap analysis can include:
- In-depth Insight: Assessment of the gap between perception and reality.
- Problem Diagnosis: Weaknesses and limitation identification.
- Solution Ideas: Solutions to areas requiring improvements.
- Corrective Actions: Allocation of necessary resources for change’s implementation.
- Performance Boost: Return on investment evaluation.
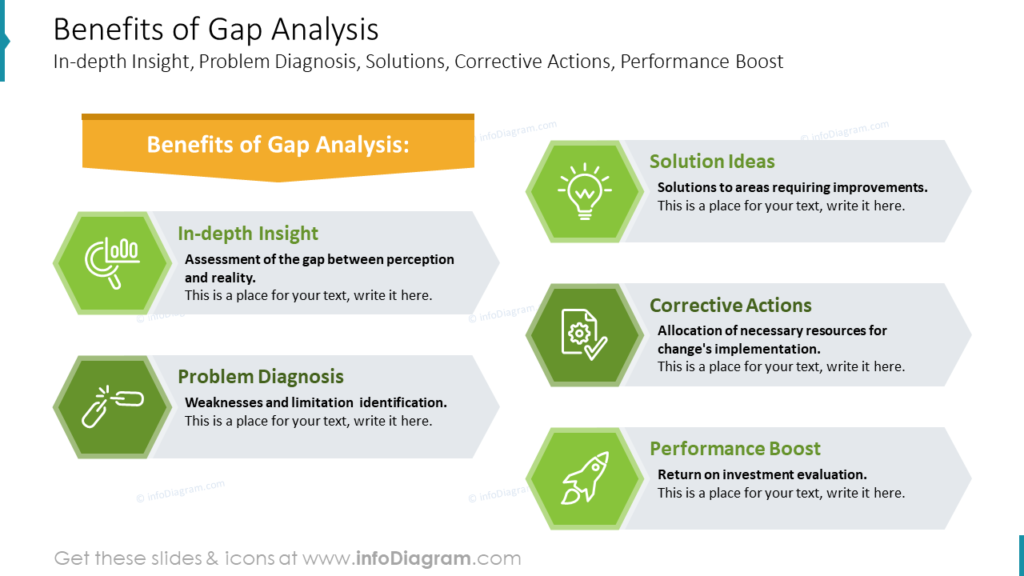
When presenting such a list on a slide, consider adding icons for each benefit. It will help create a visual association for a better understanding.
Visualize customer experience gap
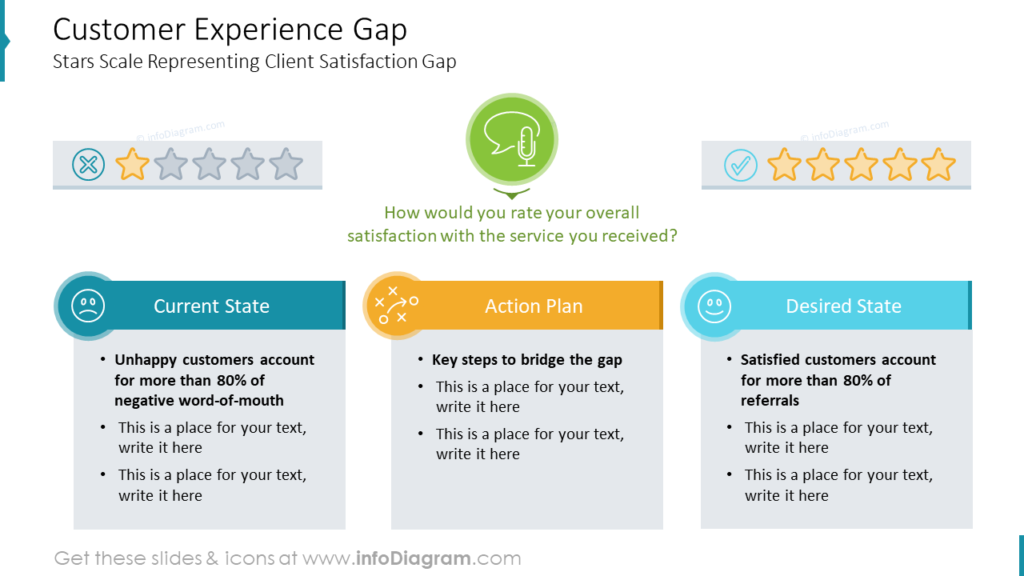
To illustrate the customer experience gap you can use a slide with three columns and a stars scale, which is usually used to present ratings. The columns can represent:
- Current State: Unhappy customers account for more than 80% of negative word-of-mouth
- Action Plan: Key steps to bridge the gap
- Desired State: Satisfied customers account for more than 80% of referrals
To show all three states, you can try the layout of three columns. Columns layout is great if you want to compare several categories. This will make it easier to include their additional information, such as customer rating stars. See how we would design it on a slide below.
Illustrate skills gap comparison
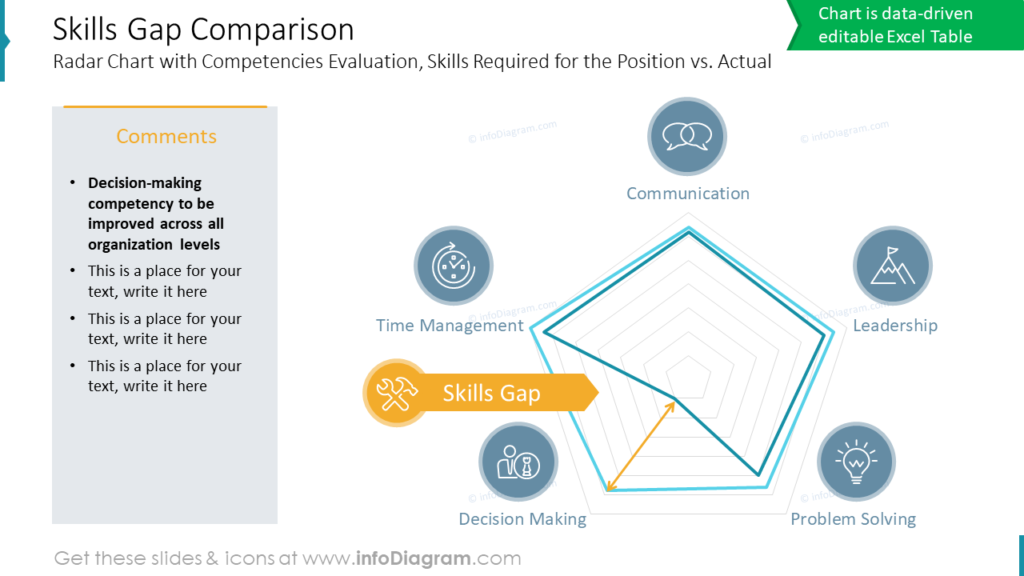
Need to evaluate the competencies of your employees? Use a radar chart to show the required vs. actual skill level of your staff, pinpointing existing HR gaps. The slide you see below contains a standard PowerPoint data-driven chart, where you can input your numbers. We added a few illustration elements on top of that data plot – such as category icons and a Skills gap pointer.
Show gap analysis states
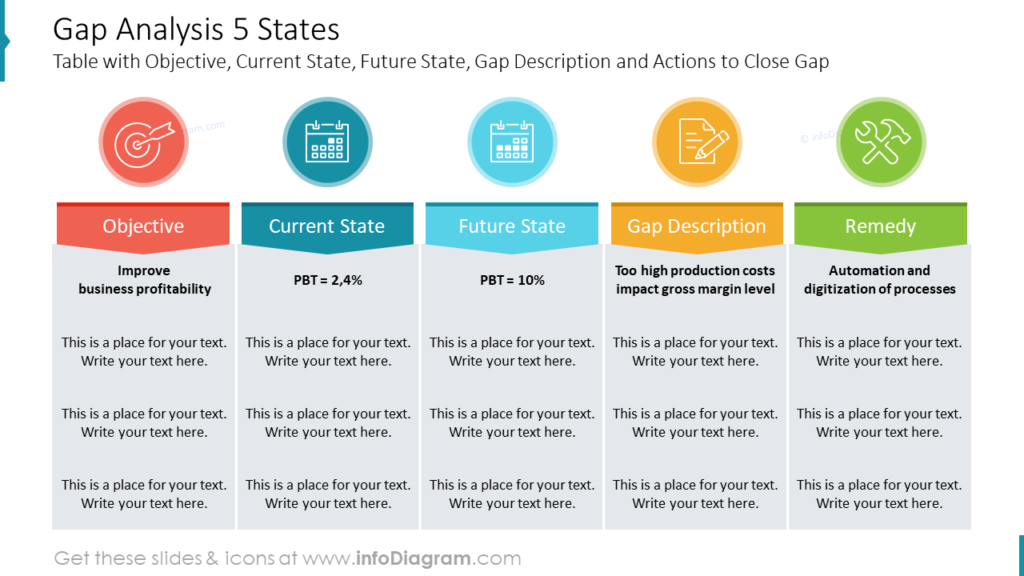
If you want to include a detailed gap analysis presentation example in your business deck, you can use such a diagram including states and actions to close the gap:
- Objective: e.g. improve business profitability
- Current State: for example, PBT = 2,4%
- Future State: e.g. PBT = 10%
- Gap Description: for instance, too high production costs impact the gross margin level
- Remedy: e.g. automation and digitization of processes
Similarly, as in the states comparison slide above, you can visualize the comparison of those 5 states in the form of columns. Consider using distinct colors and icons for each state, to make them visually attractive.
Visualize the gap analysis process
To illustrate the process you’ll follow to bridge the gap you can use a 6-steps flowchart. The gap analysis PPT process usually contains some form of the following steps:
- Identification: profit margin too low by min. 5%
- Investigation: Too low Gross Margin (34%) due to high production costs
- Decision: Conduct process mapping to discover inefficiencies
- Implementation: Eliminate, implement, standardize, or automate the processes in question
- Analysis: Conduct half-year reviews on implemented changes
- Improvement: Re-design processes that require correction
A process can be presented as a flow chart, roadmap, or timeline. Here we chose a flowchart made of chevron shapes and simple rectangles to describe specific sections.
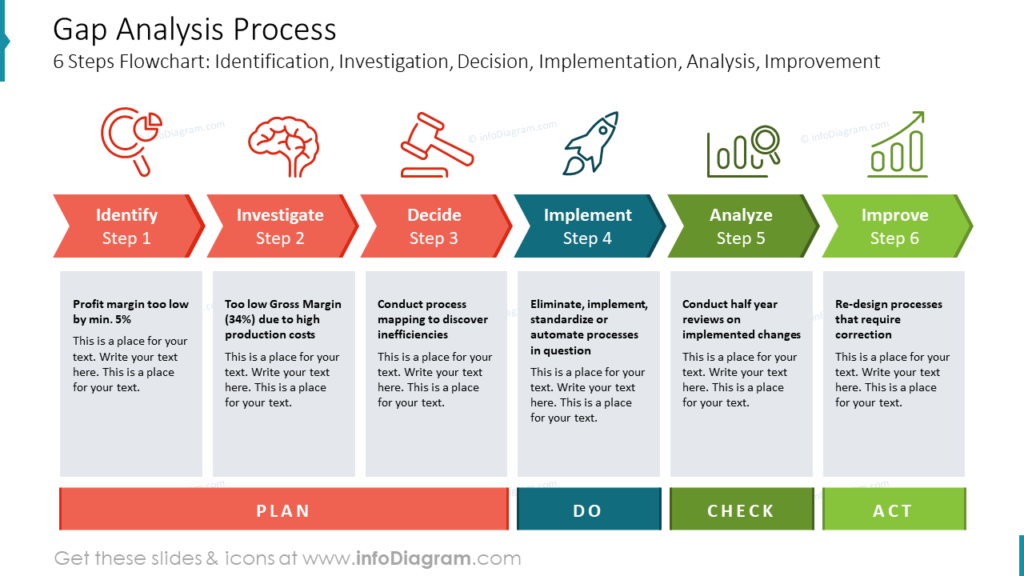
You can add an associated icon to every stage e.g. brain for investigation and rocket for implementation. If you are presenting live, the columns can be nicely animated to appear one by one.
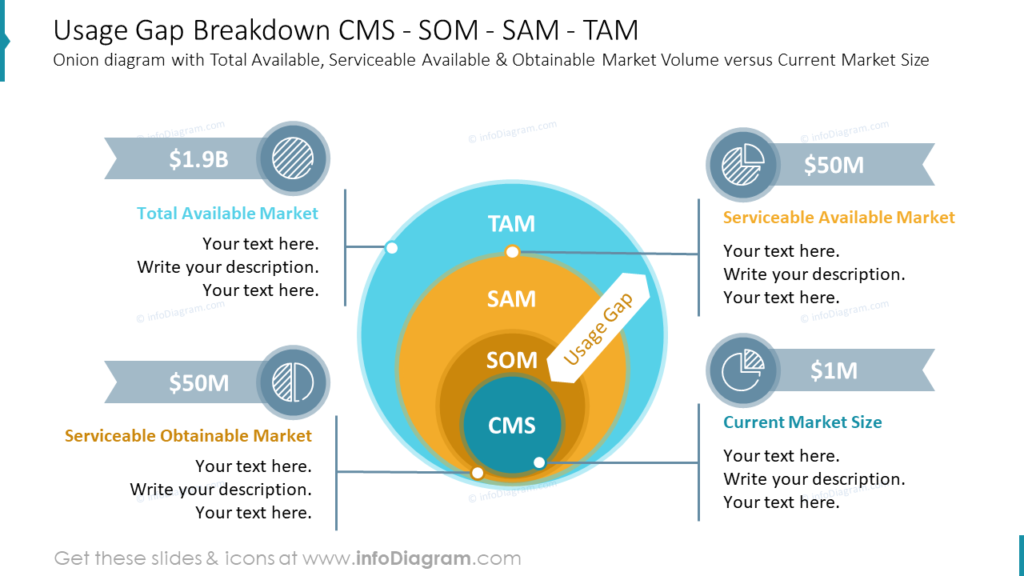
Illustrate usage gap breakdown
If you use only bullets while talking about usage gap breakdown, it can be hard to digest for your audience.
Try using an onion diagram showing the total available, serviceable available & obtainable market volume versus the current market size will make the data more visual.
The onion diagram is good for showing layers and items that have a common core.
We hope those examples inspired you to create more visual illustrative slides.
Guide on how to create a diagram to show types of gap analysis
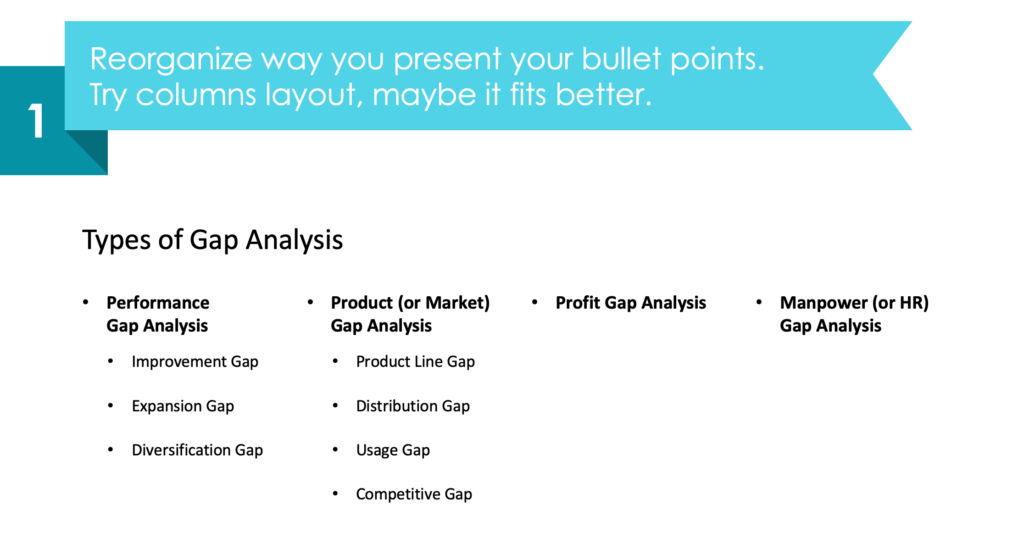
Here’s an example of a raw bullet-point slide that shows types of gap analysis:
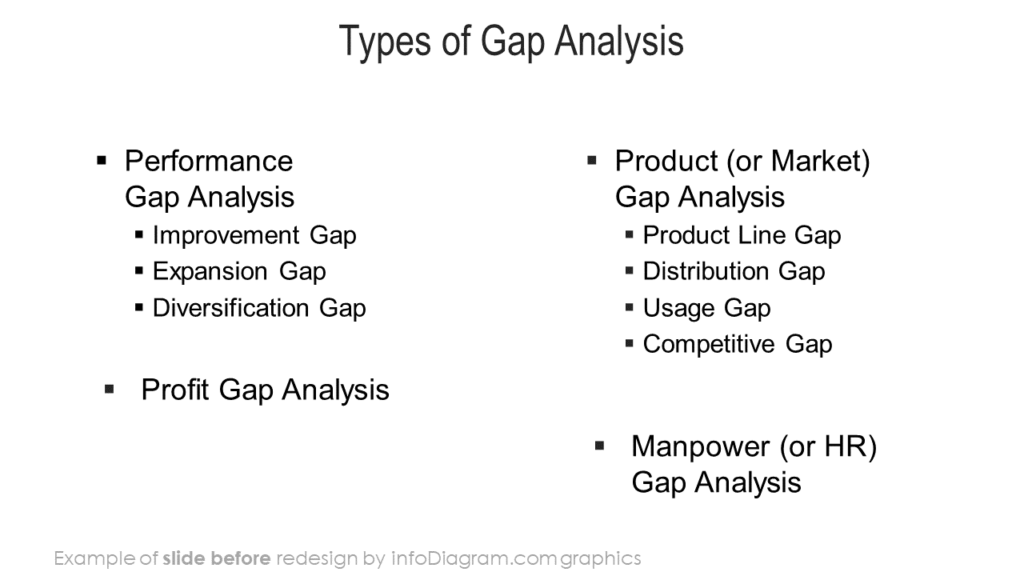
See instructions on how you can turn it into an attractive concise diagram.
Firstly, think about the best way to organize the information. Try different layouts, e.g. use columns and enrich them graphically.
Check how simple shapes, icons, and a few tricks can help you redesign the default layout into infographics and save you time.
1. Reorganize the way you present your bullet points.
Try the columns layout, maybe it fits better.
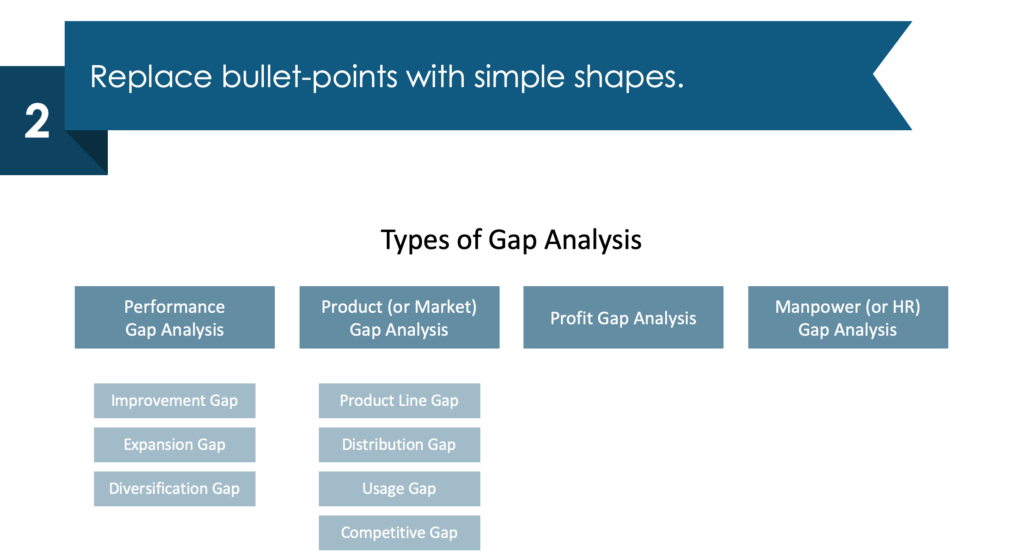
2. Replace bullet points with simple shapes.
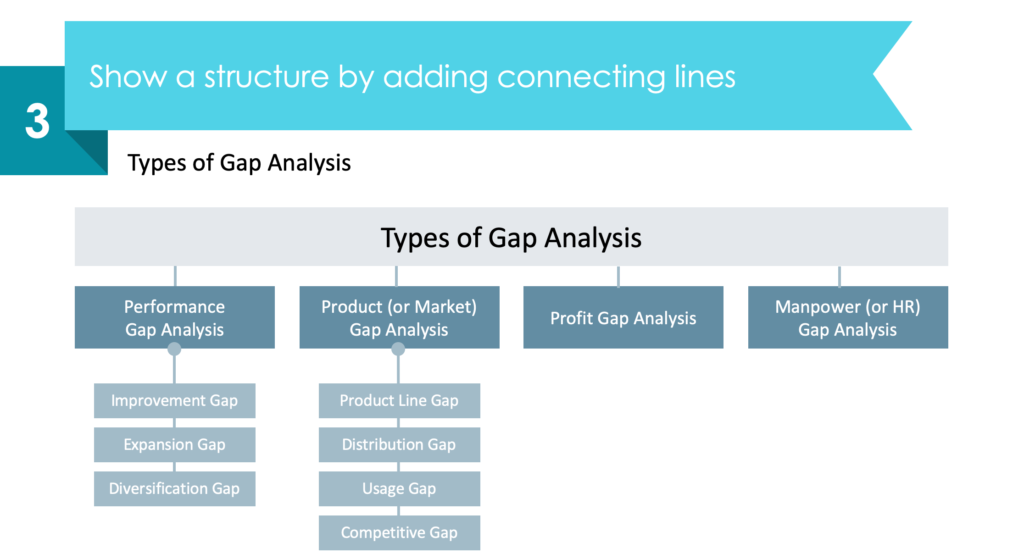
3. Show a structure by adding connecting lines.
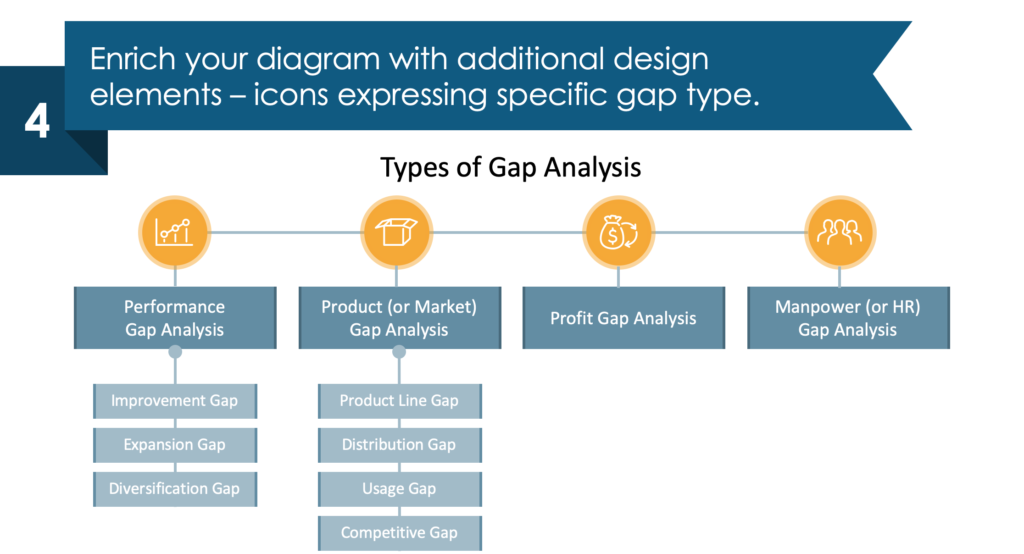
4. Enrich your diagram with additional design elements – e.g. icons expressing specific gap types.
See the guide and other examples on our YouTube channel: How to Illustrate Gap Analysis Types & Tools in PowerPoint.
If you want to help your audience connect the dots between concepts or ideas, check out this blog about using bridge graphics.
Resource: Gap Analysis Types and Tools PowerPoint Presentation
The slide graphics in this blog are a part of our gap analysis types and tools deck. It contains templates to illustrate the concept of gap analysis, its benefits, performance and brand perception gap, efficiency gap benchmark, and customer experience gap. Check the full collection here:
More Resources to Get Inspired
If you’re looking for more design inspiration, check our movie guide on how to explain gap analysis findings, types and tools (you’ll find many more practical tips on our YouTube channel):
Subscribe to the newsletter and follow our YouTube channel to get more design tips and slide inspiration.


