10 PowerPoint Decks To Illustrate Projects Review and Planning for the Next Year
As the year comes to a close in December, it’s a great time to reflect on past successes and make goals for the future. We picked our best decks so you can make the most out of the annual review and new year planning. Don’t wait till January to sit and put the goals down, better take your time and think them through.
Transform your business presentations with our expert resources. Discover more on our business performance presentations page.
For summarizing your operations in the current year you can use these 5 templates:
- Annual Report
- Financial summary report
- Stock annual report
- Project status update
- E-commerce analysis, if your business is working also in the digital area
And for planning next year those templates are worth considering:
- Annual budget
- Calendars template
- Strategy roadmaps
- Marketing strategy
- OKR planning
- 30-60-90 plan
- Business growth plan
Last year reviews
#1: Last Year’s Review and Analysis
Need to share information about your company’s last year performance? An annual report is a comprehensive overview of a company’s activities throughout the preceding year. Therefore it usually contains large amounts of complex data. If you’re looking for one deck that has it all – from the executive summary and business performance measures to revenue highlights and financial KPIs, the annual review presentation is just for you.
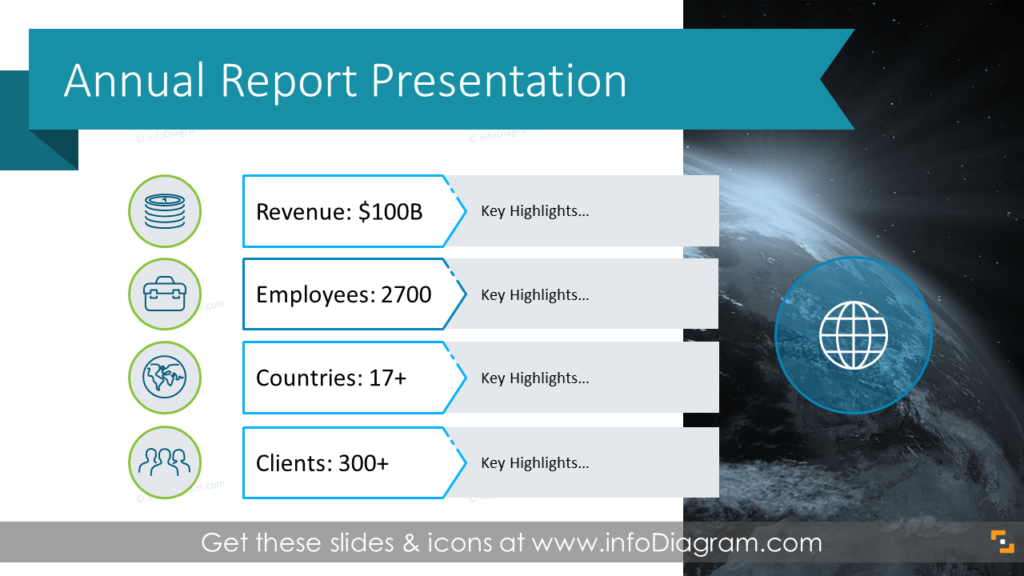
See more examples of how you can disclose your key business highlights and financial data simply and understandably to your key stakeholders.
#2: Financial Results and Indicators
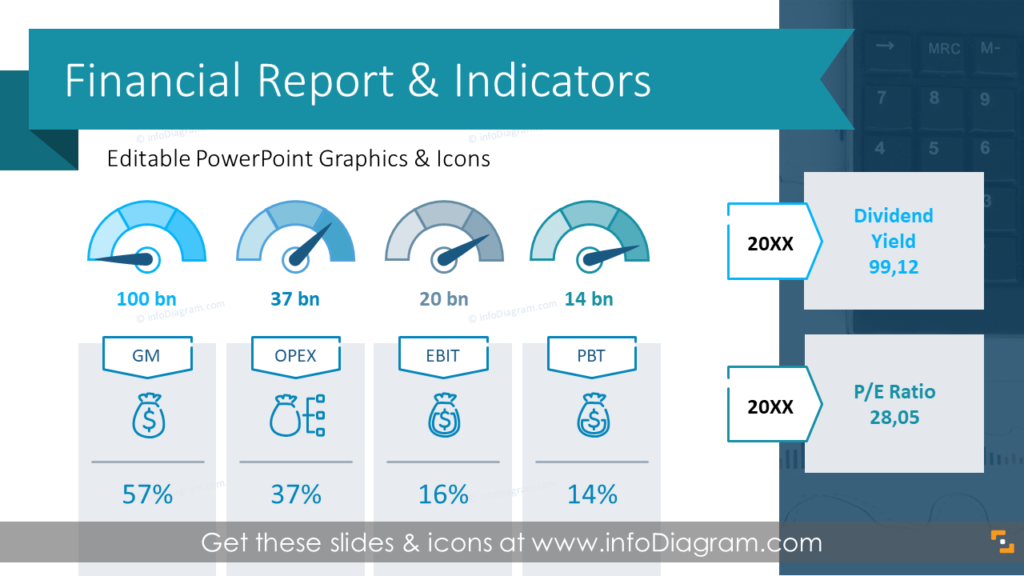
Financial reviews full of data and analysis are typically difficult to digest by non-financial audiences. If you need to show the financial results of your company including income statement, balance sheet, cash flow, or financial ratios analysis in an easy-to-follow way to your key stakeholders, check our financial report deck.
#3: Stock Financial Annual Report
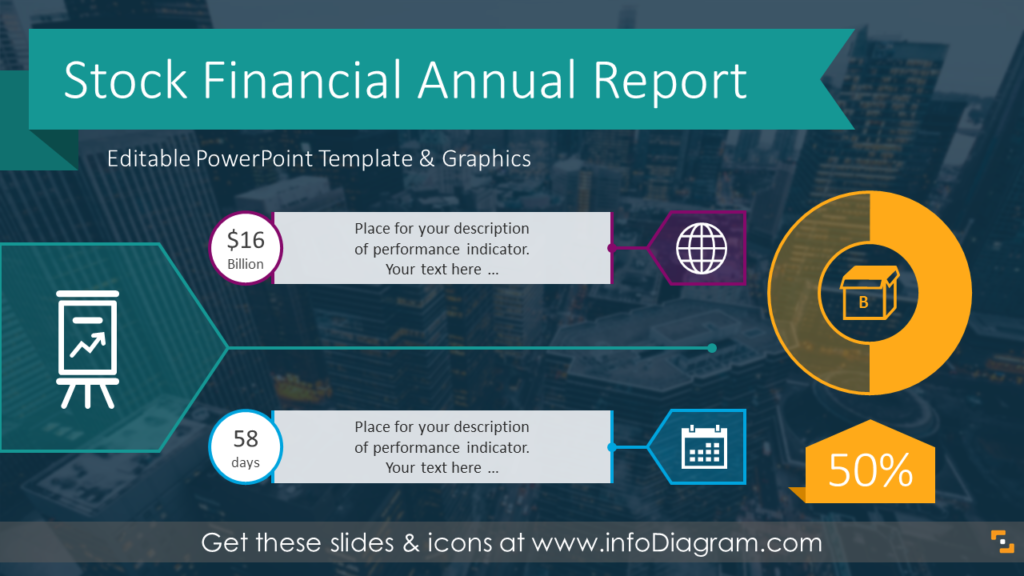
If you need to focus on presenting annual company performance for a stock exchange or other type of investor report, check this PowerPoint template with basic components covering key financial and sales information. It contains slides to show executive leadership – board members, advisors, office locations, and basic legal information needed for SEC reporting.
#4: Project Status Updates
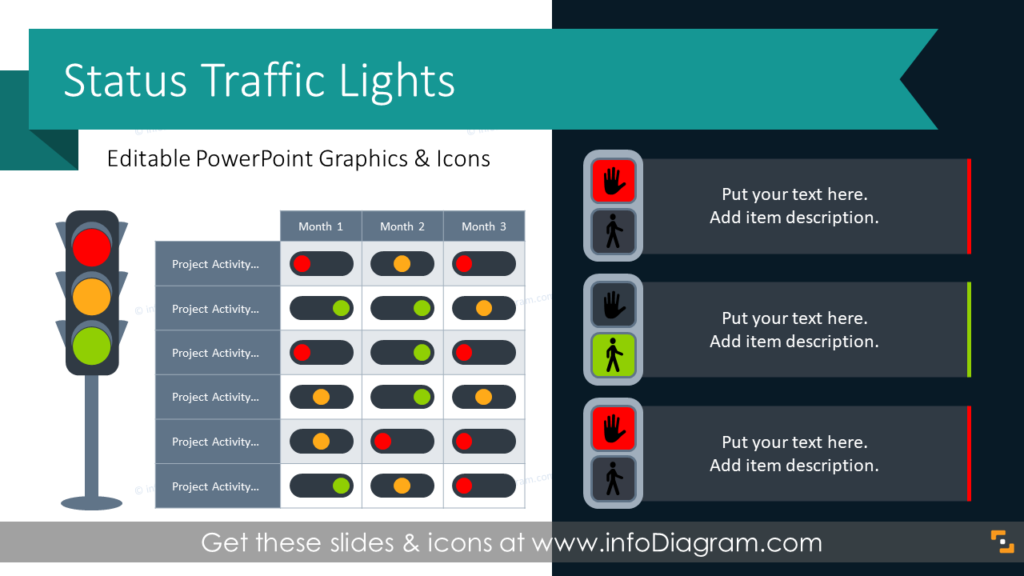
Illustrate the project activities’ status with traffic light visuals, and show what projects have to Go or No-Go by colorful RAG table graphics. Red, amber, and green colors are great when it comes to presenting tasks’ development stages. Check more ways how you can use traffic light graphics in your presentations.
#5: E-commerce Analysis Presentation
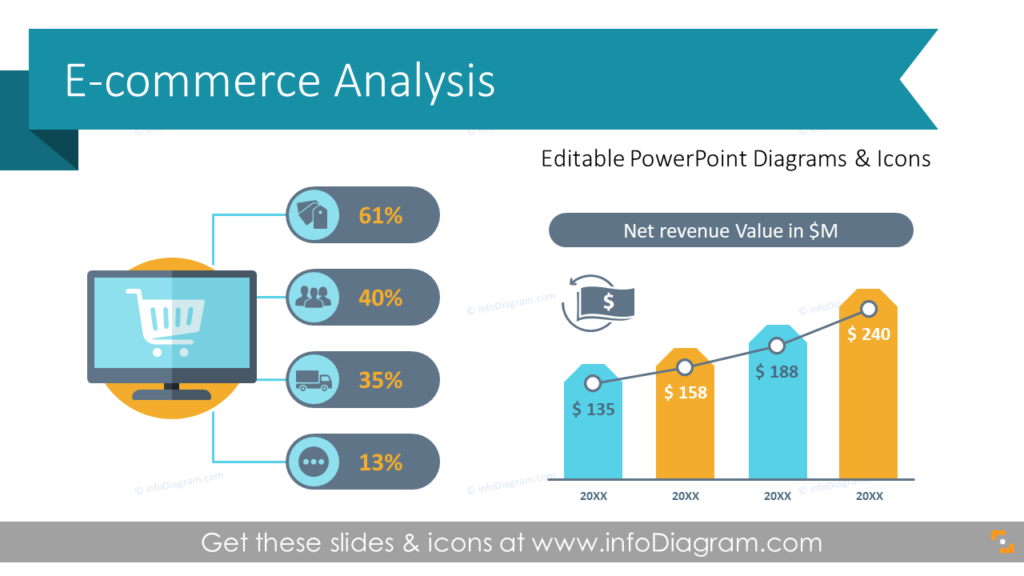
With e-retail sales growing at a speedy rate you might need to present your e-commerce strategy, challenges, performance, or metrics. See ideas on presenting various e-commerce concepts and your online store performance.
Next year Planning
#1: Annual Budget Financial Presentation
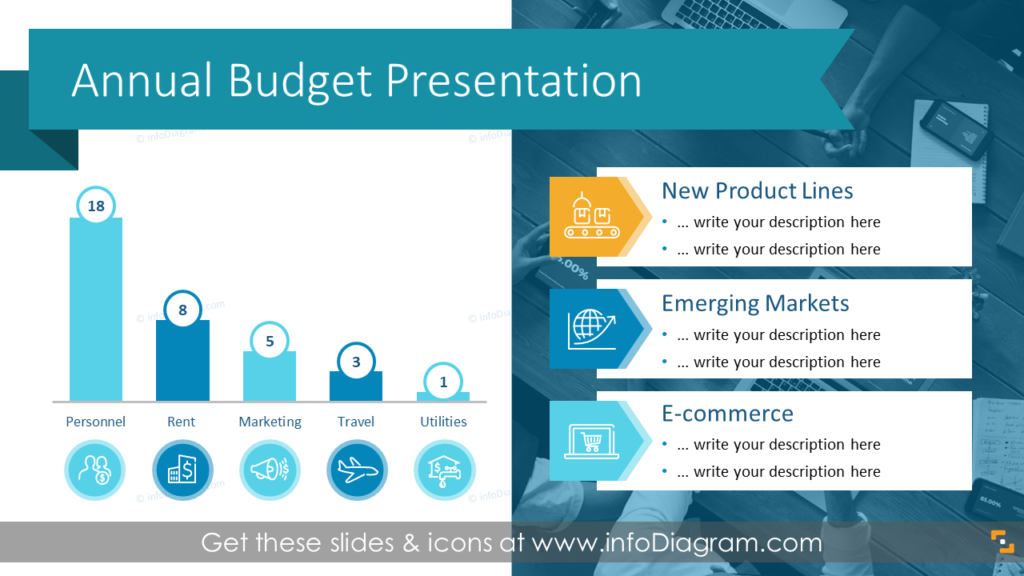
When you need to present your financial proposal to managers or executives for their approval, a budget proposal presentation is an essential tool used to communicate key financial information.
An all-in-one business budget template, covering every aspect of financial affairs, can help highlight important insights and keep the numbers organized, making it easy to track revenue, risk, profit, plan for expenses, and more.
#2: Overview of Plan and Projects
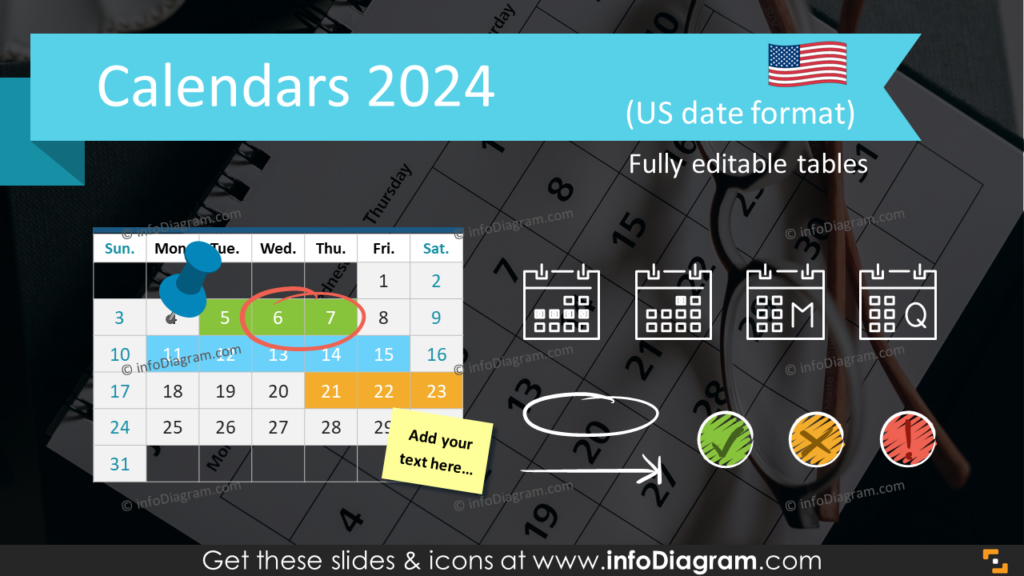
A PowerPoint calendar table is an effective visual way to present your plans and projects in a more or less detailed way. You can also give it as a handout to your team after the meeting or print such calendars to display in an office (or home office 🙂). Create a calendar that guides, inspires, and keeps everyone on track!
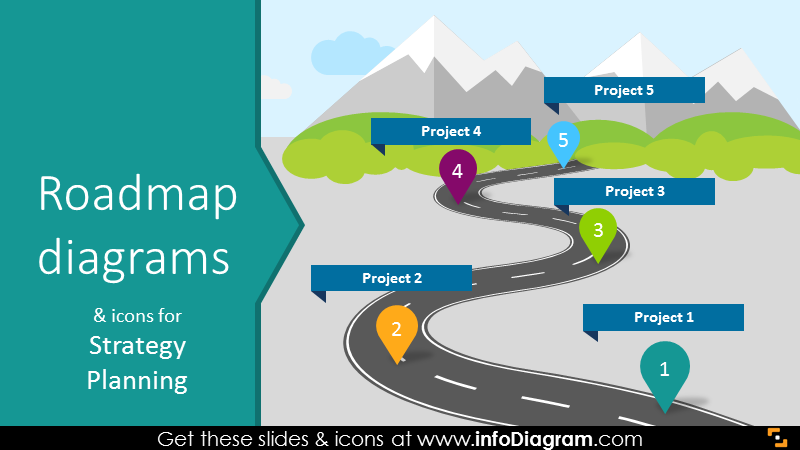
#3: Strategy Roadmaps for Long-term Vision and Action Plans
A well-designed strategic roadmap is like a GPS for your company or business. It’s one of the best tools to lift the fog and make your vision clear for everyone on the team. Whatever your planning level and context are, the visual roadmap can be one of the best tools in your communication arsenal.
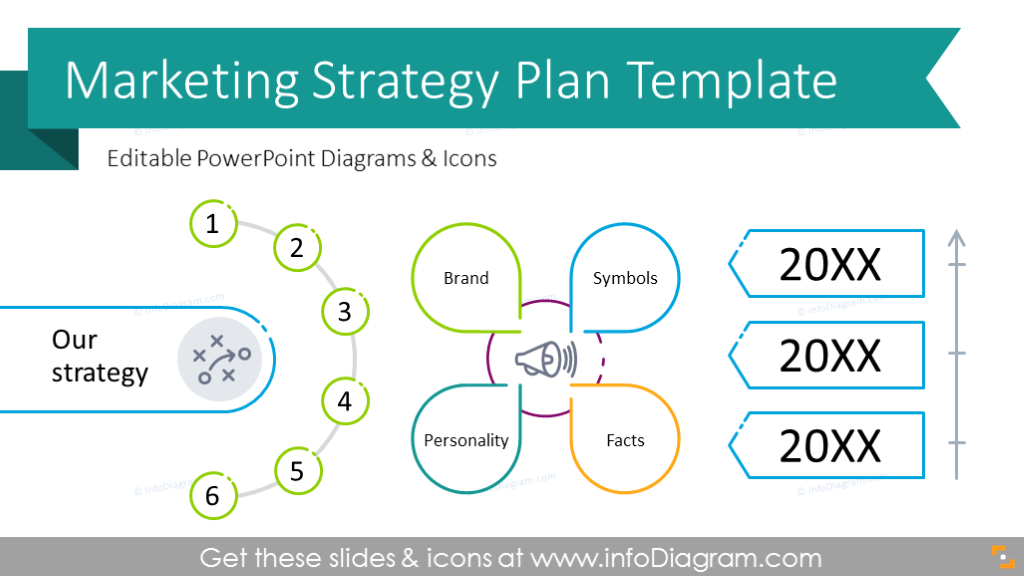
#4: Marketing Strategy Plan
Need to illustrate marketing objectives, evaluation research, product strategy, or project plan for the upcoming year? Use infographics and diagrams to visualize your marketing strategy. They will help to keep the audience’s attention and make information easily understandable for everyone.
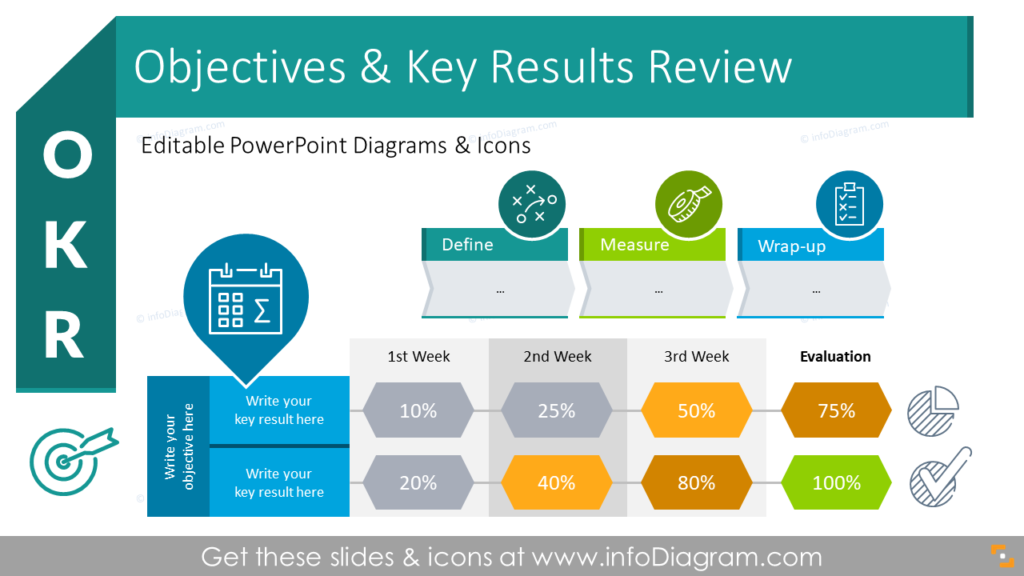
#5: OKR Objectives and Key Results Performance Review
Even if you don’t utilize OKR methodology for your annual review, you might still need to present one. A performance review can be of individuals, teams, projects, or even the company at large. No matter the size of your audience or the subject of your presentation, having concise slides will help you explain complex data, ambitious goals, and achievements.
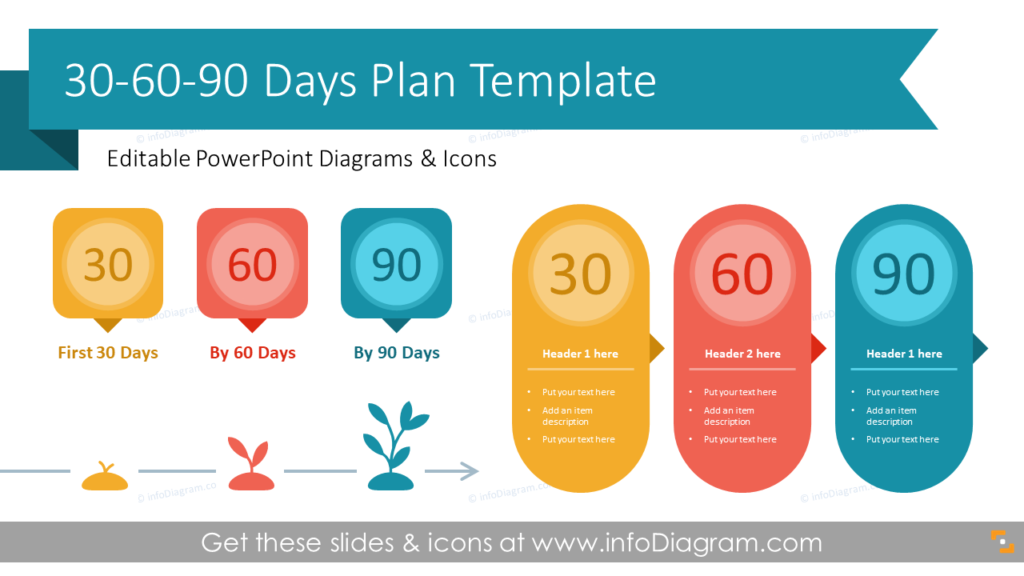
#6: 30-60-90 Days Action Plan
A 30-60-90 day action plan is a presentation of work objectives for the first three months in a new position. Besides illustrating how you’re going to accomplish goals at a new company, you can use these templates even if you didn’t change the job. For example, while creating an actionable project template to divide big goals into manageable tasks or during the performance review to show end goals.
#7: Business Growth Strategy Plan
Need to explain the ways to grow your business, or introduce a new product line, and looking for creative ways how to illustrate your plans to achieve it? Have a look at our business growth strategy plan presentation. It includes slides for visualizing the current state of the business overview, growth strategy, development roadmap, Ansoff’s matrix toolbox, market penetration strategies, new market analysis quadrant matrix, key growth drivers comparison, and more.
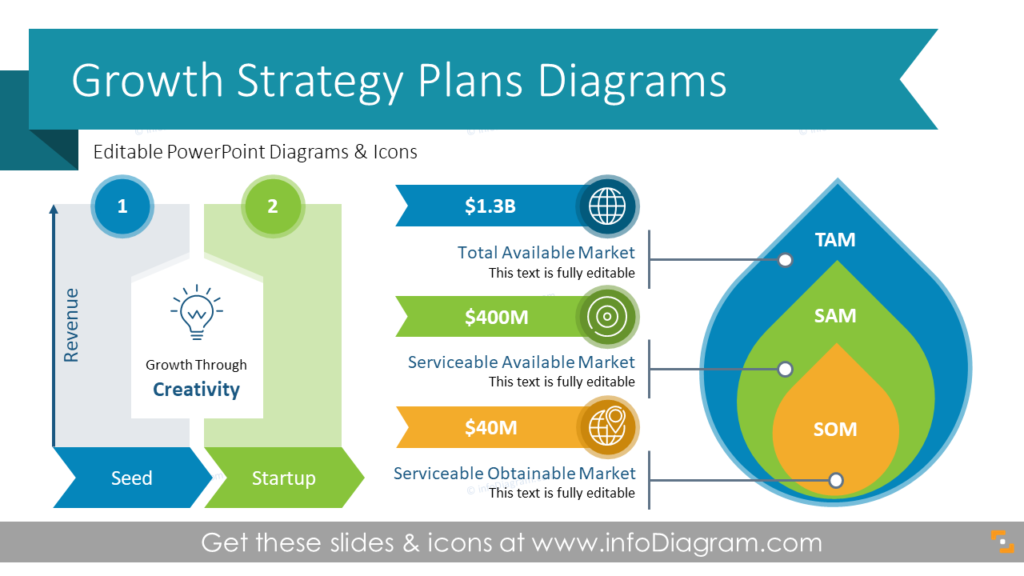
Interlacing numbers and text with graphics will improve your presentations’ readability, especially when you are planning to throw light on complex processes, analyses, or comparisons.
More resources to get you going
Want to structure your presentation differently? Have a look at the following decks, which contain general diagrams and icons:
- Ultimate outline diagrams collection – get it once, have everything in one file, and never lose time on searching graphics again
- Various data chart collections – pick the most suitable for your content
- Simple flat icons and outline modern symbols for business infographics
- Universal diagrams and flowcharts to present various business models, structures, processes, or procedures
- Editable maps in PowerPoint format
- Our most recent slide collections
For more inspiration, subscribe to our YouTube channel:
Design inspiration
- Slide ideas for effective go-to-market strategy plan presentation
- Visual frameworks for strategy analysis presentation
- Infographic ideas for post-pandemic business recovery plan presentation
- How to choose the right diagram?
- Prioritization concept visual metaphors


