A Complete Guide to Presenting Sales Business Case Study with PowerPoint Graphics
Are you about to present a sales business case study to a potential client? Make it with an impact. Get inspired on how you can present such a presentation in a visual way, that will clearly explain the challenges and solutions your case study addressed.
Below we present several graphical ways how a sales business case study can be presented. We hope our slide examples and illustrations will give you a dose of inspiration for your next sales presentation.
Get all the graphics presented here, by clicking on the slide pictures to download the source illustration. See the full Sales Case Template for PowerPoint here.
What is a Sales Business Case Study?
A presentation story about how a business problem was solved, based on real-life examples. A good sales case study contains an overview of the whole process:
- client and situation description
- needs analysis
- problem identification
- gap analysis
- solutions alternatives analysis and proposal of best one
- implementation plan of the final solution.
Focus on presenting one proposed solution and its benefits, compared with several alternative solutions. Include an analysis of financial impact, comparing financial KPIs before and after solution implementation.
Let me show you examples of how those topics can be visualized on a slide using PowerPoint graphics.
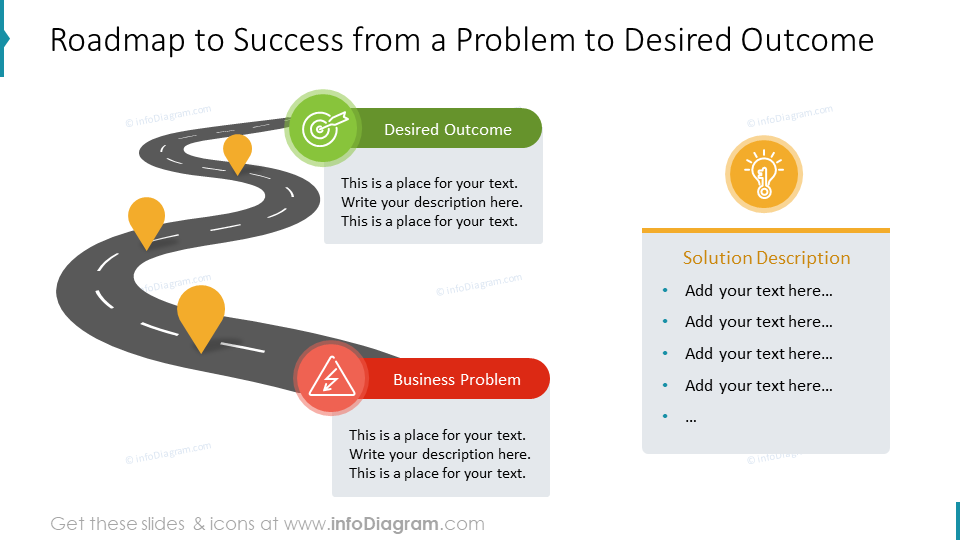
Give a big picture of the sales case, show a roadmap to success
It’s good to start by showing the big overview picture. You can use the visual metaphor of a roadmap and show the path from the problem to the desired outcome. Add road milestones of your solution – see how we illustrated it using a curvy road shape and teardrop-like points.
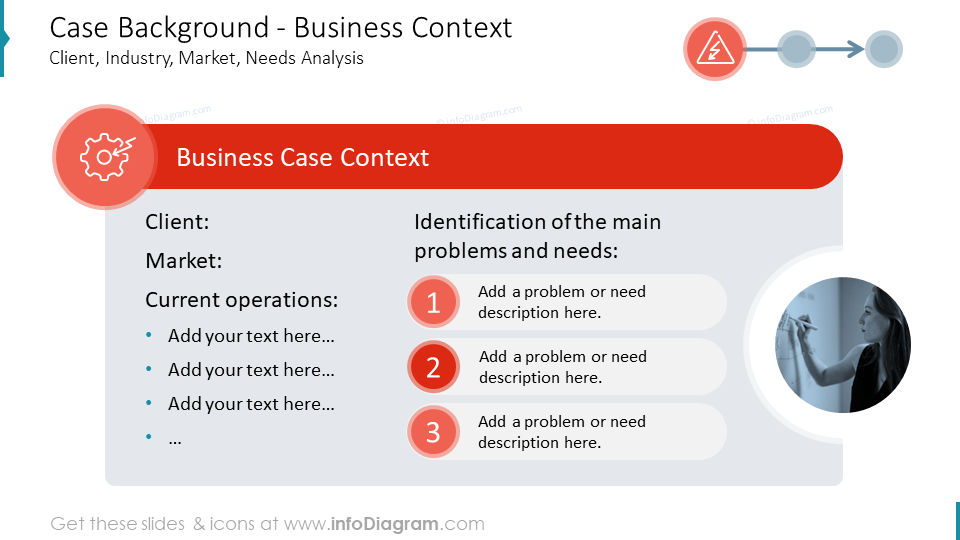
Present the business context of your sales case
In the beginning, explain the case background:
- who was the client
- what is the market or industry where the case study was done
- describe the current operations and processes of the client
- list the main problems and needs
You can present all this information on one concise slide, like this:
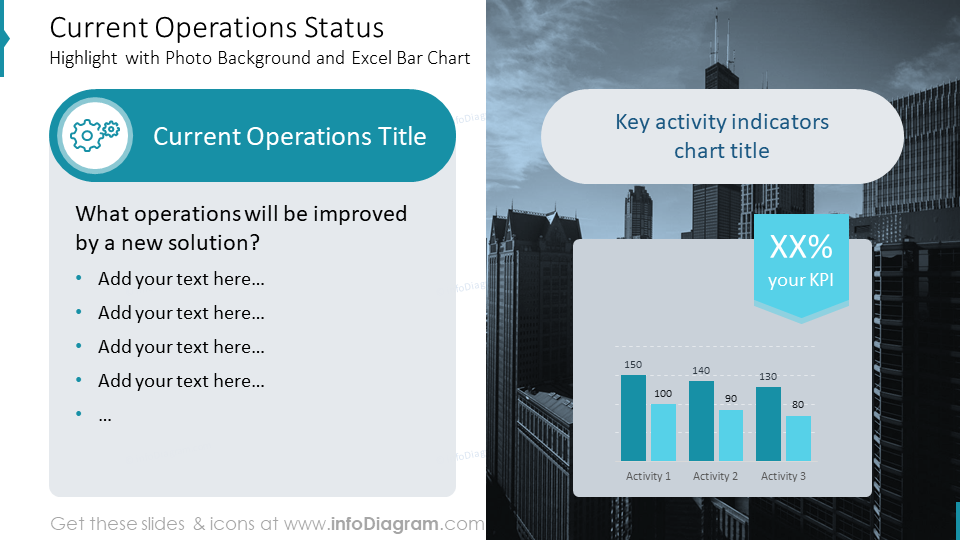
Visualize KPI improvements by real numbers
The next thing you can present is showing an improvement that your solution delivered, or would deliver after full implementation. Present data from the client’s current situation analysis, for example, the status of current operations. How much they cost, or how long a certain activity takes. Then you can compare it with the cost and length of that activity when your solution will work.
See how we used a slide layout with a vertical split, where on the right half we added a thematic picture as a background. The bar chart showing KPI improvement is placed on a picture with additional grey background, to ensure the data are clear to read. We highlighted the main KPI change with a separate ribbon shape over the graph.
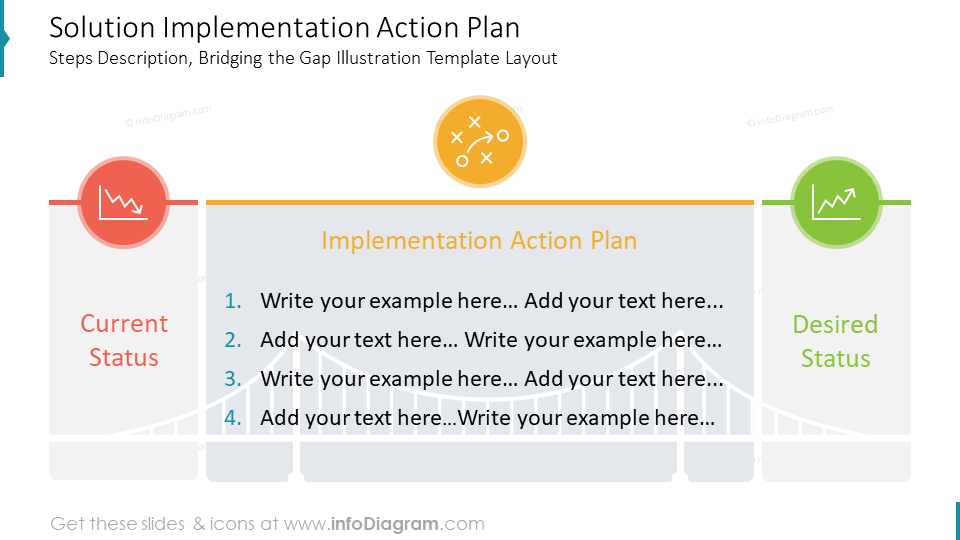
Draw a difference with Gap Analysis Bridge Infographics
Motivate a potential customer about why it is worth trying the presented solution. For that purpose, you can present a visual Gap Analysis slide. Such analysis shows the gap between current status and desired status.
You can illustrate it by using bridge infographics, where you show on one side of your PowerPoint slide the current situation description, and on another side the desired situation. The gap between is the place for your solution – that will help a client to bridge that gap.
A good idea is to use colors and icons to express the elements – red for a status – before, green for the desired status, and amber for the solution. If you don’t have those basic colors in your company template, you can also use red, green, and yellow colors from one of the standard PowerPoint palettes. I would just avoid using plain red and yellow colors. They tend to look too strong. It’s better to choose a darker shadow of that color.
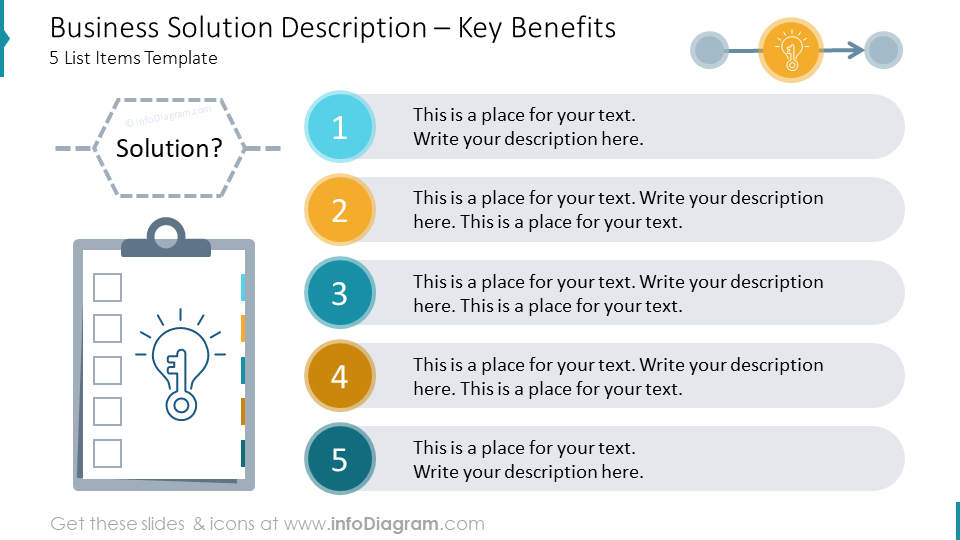
Present Key Benefits of a Solution without bullet-points
When you have a slide with a list of benefits, instead of using boring bullet points, consider using a more graphical form for each item. See below how a number of items are embedded inside a circle. The distinctive colors of the circles and their size will make them the most attractive part of the slide to look at.
You can add an illustration of the checklist to make the slide more graphical.
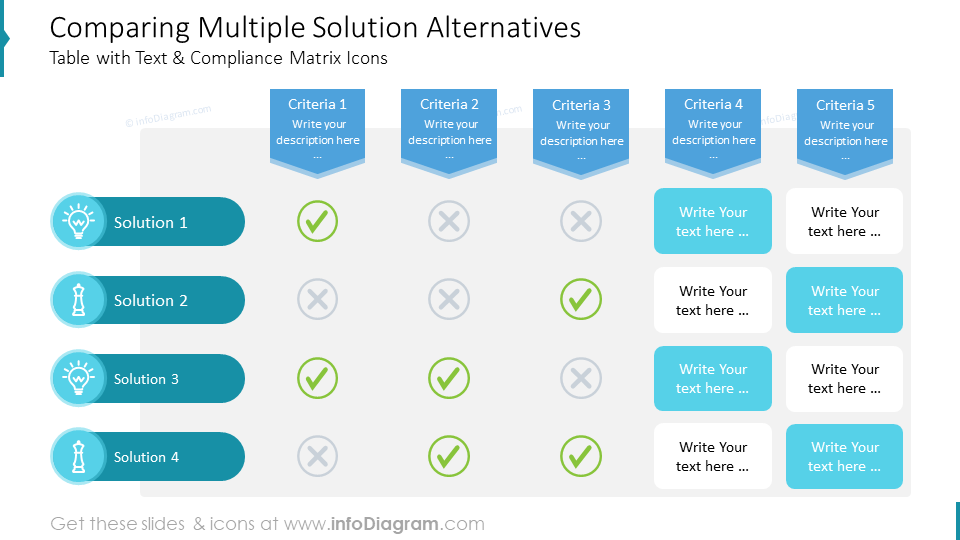
Comparing Multiple Solution Alternatives
If you want to compare several possible solutions to a business case problem, you can use a table structure. A quick way to do it is to insert a standard PowerPoint table.
However, such a table has its design limits – you can only have rectangle cells, for example. Therefore, we propose to create a table from shapes, like on the slide below. This offers you more possibilities to use the untypical design of cells, e.g. rounded corners, or easier adding of the icons.
Icons are a great way to show the presence or absence of a specific feature.
This way your comparison will look much more appealing.
How can these Business Sales Case Study slides benefit your business?
A well-structured business case presentation is a useful marketing tool for promoting a product or service you offer.
- If you are a small business, then having a predesigned template will help you create quickly professional sales and marketing materials.
- If you are part of a bigger corporation with a separate sales organization unit, then you can easily adapt this case study PowerPoint to your branding. It’s enough to copy these case study slides into your template and the colors will adapt to your palette. Your whole sales team can reuse the template, copy from each other and adapt the product story to their clients.
In both cases, having a predefined initial case presentation structure and accompanying graphics is a handy sales enablement tool. It allows your sales reps to quickly create presentations even on the run, with only adapting text content to a specific client. The recipients of the case presentation will also appreciate the clarity of the message thanks to the use of visual elements.
Concluding the effective way of presenting a case study
The well-presented case study is a powerful sales tool. Therefore, it should not be a boring monotonous presentation, but an engaging story, supported by visual slides highlighting the real case facts, process description, and measurable financial impact, if possible.
To present that information in an attractive and easy-to-digest way, I recommend using graphical forms – data visualization charts to present financial numbers, a diagram for presenting key benefits or processes, and infographic layouts to illustrate the main case KPI.
With basic design rules such as consistent style of icons and colors, not overloading the slide with content, and the use of graphical symbols, you can make a stunning presentation and overall impression.
Resource: Sales Case PowerPoint Template
The examples above used the graphics from a PowerPoint template on the topic of a Sales Case Study. All slides are available in the infoDiagram collection of presentation graphics.
Moreover, you can extend the deck with a universal set of elegant outline style diagrams right here with different graphics, styles, and a lot more.


