Design Project Management Presentations Faster with These PPT Templates
Managing a project, need to keep track of your team’s progress, or explain project management frameworks? Using visual aids can help you present more information by using less text and make your slides more catchy by using graphics. With that in mind, have a look at this list of 7 recommended templates for project managers.
Whether you’re looking for PM frameworks or concepts to use, or you already have a clear idea and need to make a presentation, consider looking at some of the project management presentations we’ve recommended here.
Get any of the graphics presented here – click on the slide pictures to see and download the source illustration. Check the full collection of Project Management PowerPoint Templates & Icons here.
7 Recommended PowerPoint Templates for Illustrating Project Management Presentations
Here is an overview of the aforementioned presentation templates, designed for project managers, professionals working in related fields, or anyone who needs to put together a deck on the topics below; to help you make your presentations more visually appealing & engaging.
We selected those topics that may be relevant for PM professionals:
- Status Review presentation with visual aids and slides typical for this type of review meetings
- Kanban board presentation – with predefined boards, cards you can easily edit in PowerPoint.
- Scrum method presentation with graphics toolbox for various roles, meetings and processes used in this agile PM approach
- Project or product roadmap graphics for presenting stages and milestones in catchy visual way
- RICE task prioritization scoring tables and explanations
- Lean management concept presentation
- Explaining Six Sigma and DMAIC diagrams
Let’s explore those 7 topics in more detail:
Status Review Meeting Template
These simple and elegant graphics will help you if you’re undertaking tasks such as analyzing KPIs, having a review meeting, or presenting key data. This will help you save time when putting together your presentation, and make it more memorable to the audience.
The template comes with 47 icons in a modern, flat design style to help keep a professional look. You can use these to represent various aspects of your presentations.
If you’re wondering how to effectively manage a review meeting, as well as other situations where you’d use a project management presentation, this blog will show you how to do this with the help of some visual slides.
You can use this Review Meeting Template to:
- Visualize goals
- Current situation overviews, including presentation of KPIs
- Keep track of your business’s next steps
- Outline what topics will be discussed and in what order
- Clearly show meeting agendas, structures, and outcomes
- Create lists, agendas, timelines, and further steps diagrams
- Evaluate current market and company situation – adjust strategy to this situation, and set new objectives
- Distribute new tasks over a time plan and hold people accountable.
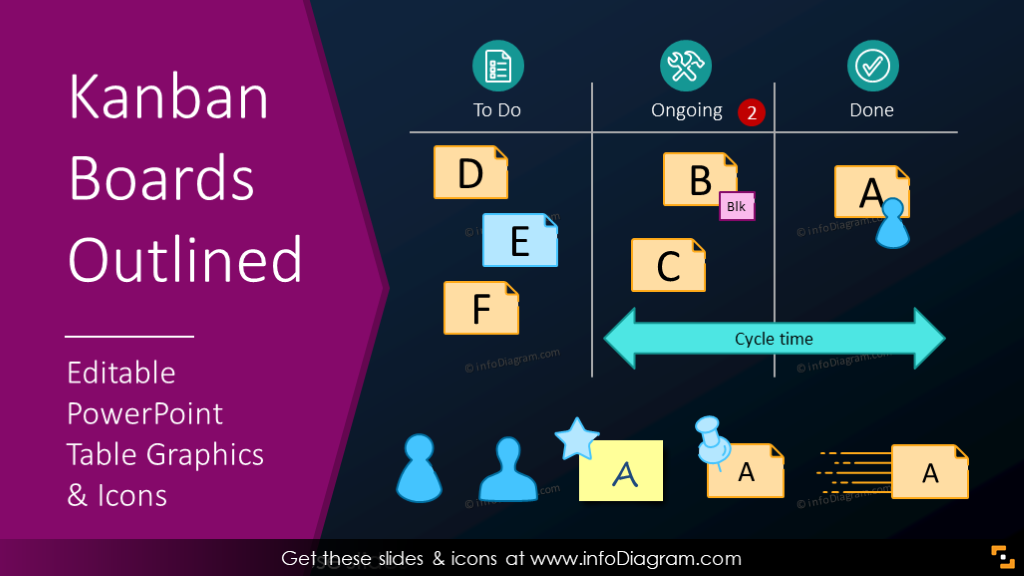
Kanban Board Template
Kanban is a visual system for project management. Today it’s widely used as one of the Agile methods in PM. The natural form of Kanban is having a physical board with paper post-its; easiest and most effective if you can meet with your team in one place.
However, if you need to document, reproduce, or share your Kanban tasks, you can use PowerPoint. Check this set of Kanban template slides, which includes task cards, various Kanban Tables, and icons – in a light modern style!
Where can you use Kanban graphics?
- Software development (the most typical use of them is in the IT sector)
- As an agile Project Management method for practically any product development.
- Graphic design project management
- Personal task management
Scrum Presentation Template
The Agile Scrum PPT Graphics Set is a universal visual toolbox with modern outline icons. If you’re a presenter or trainer using the agile framework, it’s a handy tool for explaining project roles, duties, and flowchart processes.
This slide deck contains various agile process diagrams and common scrum-related symbols that you can use to create, for example, a Scrum training presentation or a slide deck for agile project management meetings.
Where can you use Scrum Presentation Templates?
- Daily Scrum meetings
- Feedback Reviews
- Retrospective meetings
- Scrum training presentations
- Agile project management meetings
This blog shows you how you can illustrate a Scrum presentation effectively.
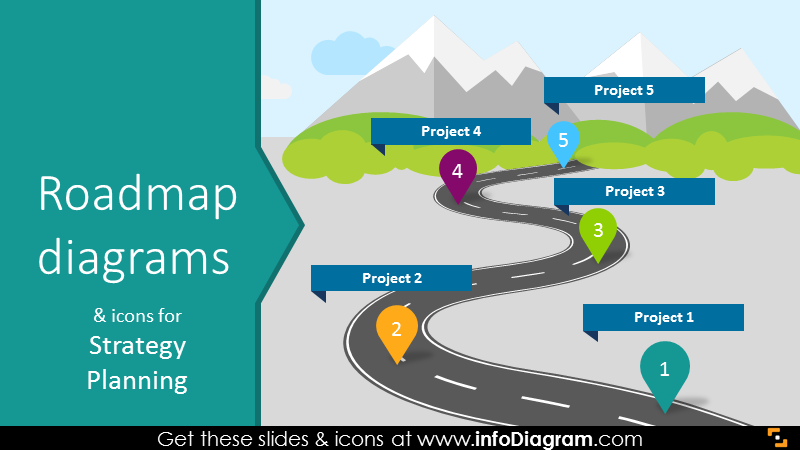
Roadmap Diagrams and Infographics
The roadmap diagrams and timeline infographics can be used for a multitude of purposes such as creating strategy and project plans. You can use them to easily show long-term milestones or present project objectives or stages over a year or multiple years.
This set includes a variety of infographics and icons in a flat style. They will help to represent certain aspects such as milestones or deadlines. Icons come in a vector graphic format to preserve image quality.
You use roadmaps to illustrate the following concepts:
- Various kinds of strategies
- Company history timeline
- Project plans or progress
- Annual reports
- Personal goals
Here are some further resources related to this topic:
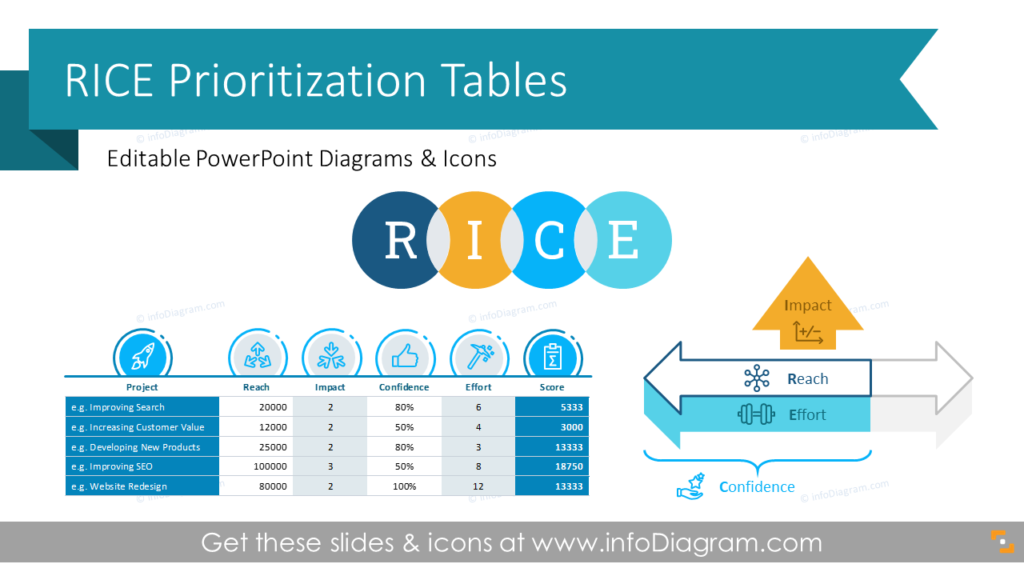
RICE Prioritization Score Tables
If you are deciding on the development of new product features or presenting the prioritization of work tasks/projects, the RICE prioritization framework can be a good visualization tool for that. RICE is a simple formula that includes 4 criteria (Reach, Impact, Confidence, and Effort) to calculate a score for new projects or product features. A RICE score is used to prioritize workload, taking expected effect into consideration.
The RICE slide set includes numerous slides, diagrams, and icons. Plus all elements are fully editable, so you can easily adapt the slides to your needs:
You can use RICE tables to:
- Explain what the RICE formula is and how it works
- Analyze possible product development strategies along with their potential impact on product sales/performance
- Evaluate what service features are the most valuable
- Clearly present the prioritization of new features
- Easily calculate a RICE score using an Excel sheet with a building formula
- Visualize the result of new product development strategies
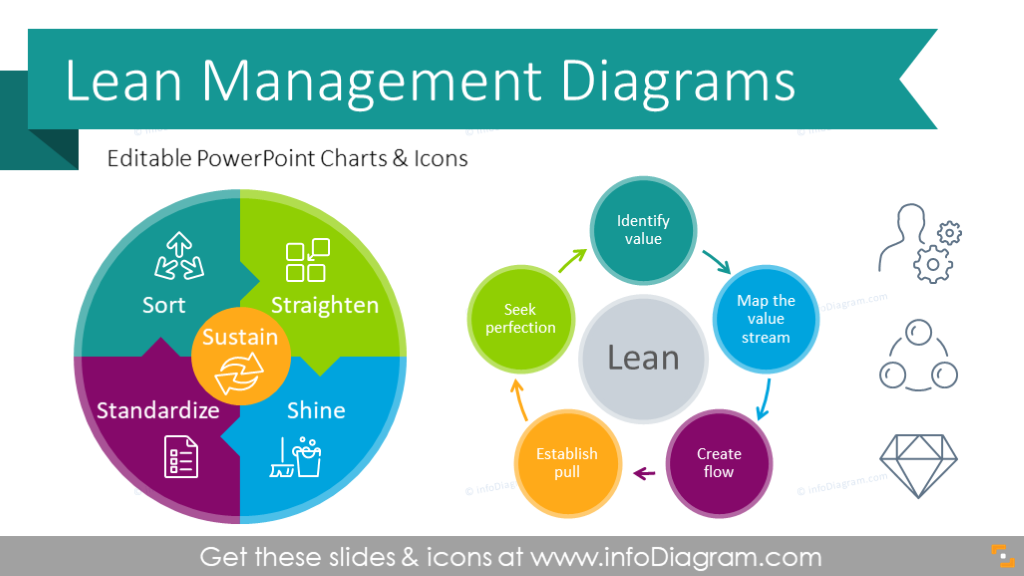
Lean Management Presentation Diagrams
Lean management is a way of managing a company or institution ensuring continuous improvement using small changes in processes to deliver value to customers.
These PowerPoint infographic charts are for illustrating lean management principles and fundamental lean methodology. You can use these diagrams to provide visualizations for lean overview presentations or articles on the Kaizen approach to manufacturing or services, for example. We included a visual representation of all basic lean procedures and elements:
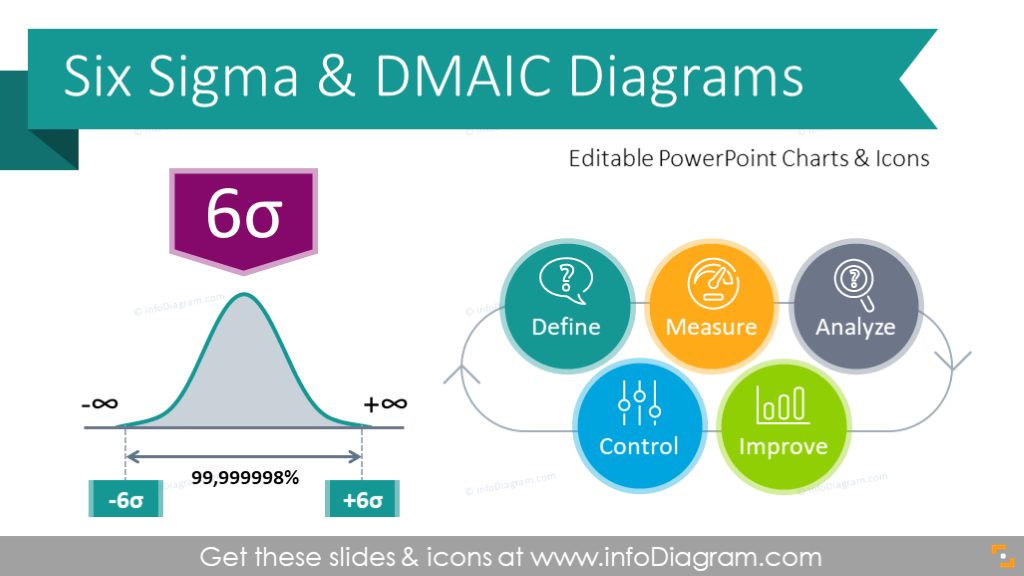
Six Sigma Presentation DMAIC Diagrams
The Six Sigma approach is to create a quality improvement process/system. The main principle is to systematically work on decreasing the number of defects in the production process – to a statistically insignificant level (hence the 6 sigma name).
This set contains templates for Six Sigma training and presentation materials. We designed editable infographics explaining Six Sigma principles, underlying statistical theory, and main 6S processes such as the DMAIC cycle, DMADV cycle within DFSS, Concept Questions, or Lean Problem Solving Workflow. With these diagrams, you can visualize the Six Sigma approach to production or general business process improvements.
You can use Six Sigma Diagrams while talking about the following concepts and topics:
- Manufacturing processes
- Supply chain operations
- Engineering/construction
- Healthcare processes
- Explaining the Six Sigma methodology
- Reviews and reports
Explore our Business Performance PPT Reports category on the website for more resources to boost your presentation impact.
Summary of the Best Visual Metaphors for Project Management Presentations
Presenting project management topics can often be a time-consuming, wordy, and unengaging process. With pre-designed templates, you can cut down on the time spent putting together presentations and put it to use on more important tasks. Using some of the infographics and colorful diagrams we’ve recommended here can help to reduce the amount of text you use while helping to keep your audience active.
There are additional benefits to using ready-made diagrams and icons. You could export slides as a PDF to share with project members & others interested. You might also save individual infographics to reuse in other presentations.
For more inspiration, subscribe to our YouTube channel. Here’s one example presentation from there:
Resources: PowerPoint Templates & Graphics for Project Management Presentations
Explore all of our Project Management PowerPoint templates, including the 7 we’ve shown here:
If you wish to read more on project management presentations & scrum, check out these blogs. We also have blogs on product development for you to look at.
To try out how those PPT diagrams work, get a sample of free PowerPoint diagrams and icons that you can use to play with this kind of presentation graphics.


