4 Recommended Graphic Sets for Your Supply Chain & Logistics PPT Presentation
Managing supply chain operations, trying to choose the right supplier, or having to explain logistics concepts? You don’t have to use whole paragraphs when you’re presenting; instead, you can use visuals and infographics to help you cut down on unnecessary content and engage your audience more. All while saving time so you can work on more pressing tasks. Leading on from that, have a look at these 4 templates for logistics presentations we recommend for supply chain managers and similar professionals.
Whether you’re just looking for something to complement an existing presentation or need ideas on how to format and design your PowerPoint, read on and see if anything below suits you.
Get any of the graphics presented here – click on the slide pictures to see and download the source illustration. Check the entire collection of supply chain PowerPoint templates here.
4 Recommended PowerPoint Templates for SCM and Logistics Presentations
Below you’ll find an overview of the four supply chain management templates we recommend, designed for anyone who needs to prepare a presentation on logistics and similar areas. These visuals will help you to grab, and hold, your audience’s attention, distinguish your presentation above the rest, and free up your time.
Logistics PowerPoint Icons Package
These vector icons will help you if you are working on supply chain processes, transport means, locations & buildings, product life cycles, or other logistics topics. By using icons such as these, you are able to visualize your ideas & content better and therefore your audience will understand better.
You’ll find almost 200 unique icons with which to complement your presentation. A modern & professional graphics style will help to enhance your content; there are also hand-drawn and scribble-style icons if you wish for a more charming and personal feel!
What topics could you use these logistics icons for?
- Transportation methods (road, rail, air, etc)
- Supply chain processes
- Buildings/warehouses
- Countries, cities, and other geographic locations
- Supply chain management
If you want to find out more about illustrating supply chain presentations, you might want to check out this supply chain blog.
PowerPoint Maps of Countries and Regions
Require geographical maps for your supply chain or logistics presentation? These editable template sets, in PPT format, feature the continents, countries & regions as vector graphic shapes. This means you can edit the map colors to fit your brand or data or ungroup them to zoom out to specific geographic areas.
Both sets contain a collection of additional icons for illustrating the main demographics, economic data, and other location-related aspects.
World Maps (Continents & Countries)
This graphics bundle of major global locations is useful for a variety of purposes within and outside of supply chains & logistics. World map templates are invaluable for showing real geographical locations, especially if your company is international or you plan to expand to new markets. Their full editability means that you can cater them to your requirements e.g. changing colors to match your corporate palette.
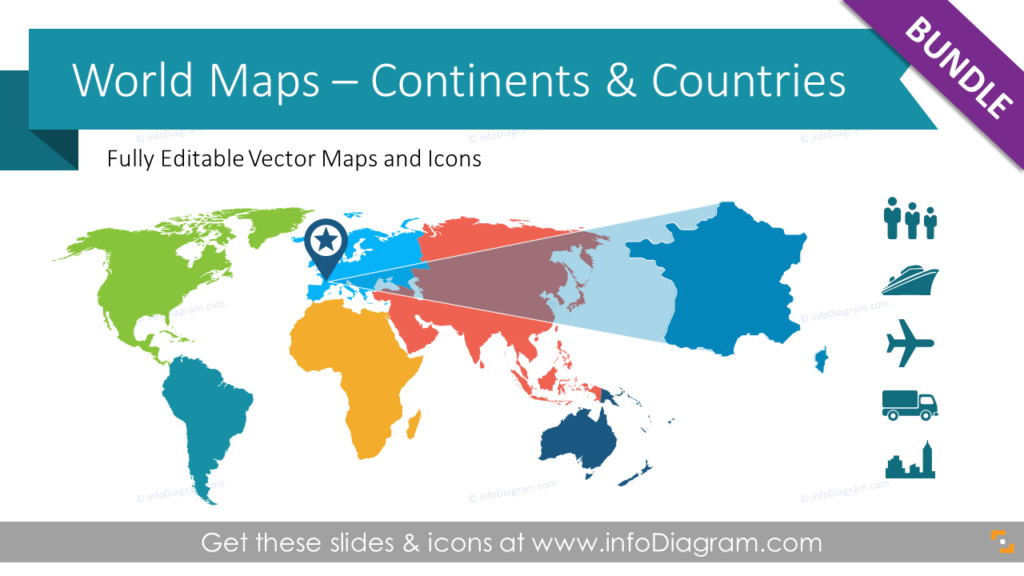
With more than 200 graphics, you’ll certainly find ones to suit your presentation. As with the last package, this has both modern and hand-drawn styles for you to choose from. Icons are also included to represent aspects such as factories and transportation methods.
Maps of North America (Canada, USA & Mexico) Regions
Not all companies have an international reach. Perhaps your company is a small or medium business in North America, or you’re looking to expand to that area. You’ll be able to visualize those locations with ease by using these vector maps.
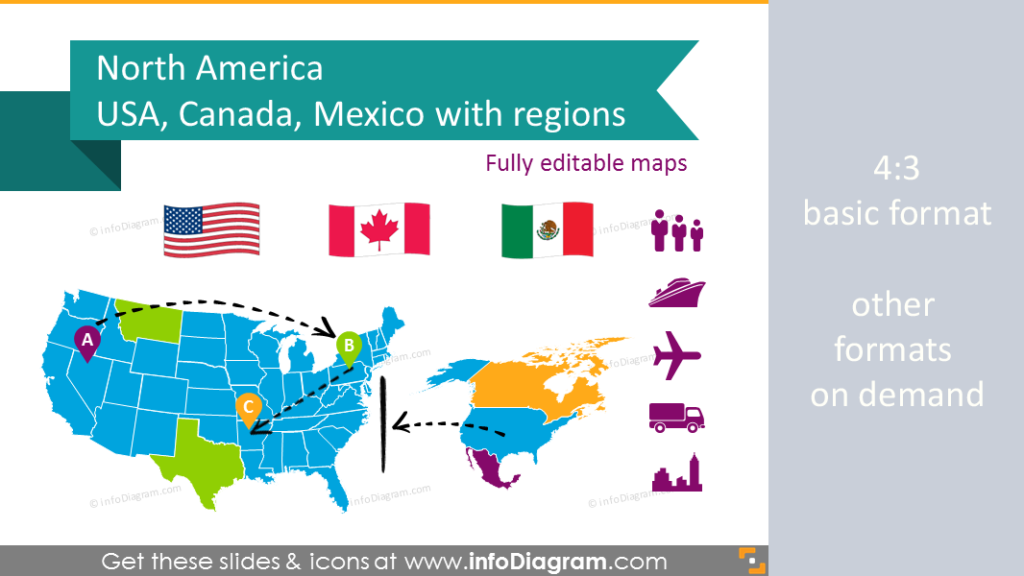
90+ maps, and a generous helping of icons & country flags, provide you with a good range of graphics that you can furnish your PowerPoint with. As well as geographic location, you can represent demographics, population, GDP, transport, etc.
Where can you use these map graphics?
- Supply chain optimization topics
- Warehouse network diagrams
- Distribution center location slides
- Supplier meetings
- Production & manufacturing center presentations
- Presenting country statistics
- Showing subsidiary locations
For more information on how you can use map graphics in a presentation, this blog page might come in handy!
Supply Chain Icons for PowerPoint (in 3-D!)
These vector icons allow you to realistically present various logistic flow charts, raw materials, retail locations, and other supply chain topics. The set has the advantage of layouts with built-in isometric grids that allow you to place logistics icons and draw arrows between them.
Wish to stand out from the trend of flat, 2-D graphics? By making use of 3-D icons, your presentation will be able to attract more attention and set itself apart! As they’re pre-designed and ready to go, you will be able to save time when preparing your next PowerPoint or Google Slides presentation.
Uses for these 3-D supply chain icons include:
- Illustrating specific supply chain components (production, distribution, retail…)
- Presenting detailed analyses of distribution point and delivery methods, including delivery to the end-customer
- Showing E-commerce ordering processes
- Presenting the repair process from customer service calls and spare part deliveries to on-site technicians
- Explaining supply chains for a variety of purposes, such as training
- Help those who are part of the process, from procurement to production, explain what role they play
If you’re still curious about why you should 3-D icons in a presentation, this blog here is worth a read. If you want to know how isometric grids work, check here.
Ecology PowerPoint Icons (Sustainable Transport & Architecture)
Many corporations make it a point to be more sustainable; many consumers look for this when choosing a product. Maybe you’re looking at how your distribution processes could be more green, or how you could incorporate more recycled or sustainable materials into your products. These icons can be used in conjunction with these and similar applications. For example, you could use them in review meetings, training, logistics presentations, marketing e-mails, etc.
The professionally-designed icons come in a vector graphic format, so they can be resized without loss of image quality. Your presentation will also benefit from a modern look & feel as they come in a simple flat/metro UI style.
Where might you use these ecology icons?
- Sustainability reports and strategy presentations
- Comparison diagrams of transportation means e.g. gasoline usage per mile per passenger
- Green transportation hierarchy pyramids
- Fuel economy presentations
- Impact of current transportation methods on the environment
- Green energy production and consumption topics
Summary of the Illustrations for Supply Chain & Logistics Presentations
Many presenters will wish to improve their presentation skills. Working on your delivery and technique is one way. Another (that you can use today) is to upgrade the look & feel of your presentation. Using some of the graphics we’ve illustrated here will help to give your PowerPoints a professional edge and stand out from the rest – factors that are useful in impressing your audience!
They say that a picture is worth a thousand words; PowerPoint graphics are no exception. Since many people are visual learners, you can take advantage of this and use graphics to condense detailed and complicated topics into simple visuals. You’ll be able to help both yourself and your viewers to comprehend the topic.
Resource: PowerPoint Templates & Graphics for Supply Chain and Logistics Presentations
Take a peek at all of our Supply Chain and Logistics PPT templates, including the 4 we’ve recommended here:
Should you wish to read more about supply chain and logistics presentations, have a look at these blogs.
To try out how those PPT diagrams work, get a sample of free PowerPoint diagrams and icons that you can use to play with this kind of presentation graphics.


