6 Graphic Decks for Effective Operational Marketing Presentations
Operational marketing incorporates various processes and topics you may need to coordinate and present, like project calendars, analytics, funnels, survey results, etc. Visual aids will help you illustrate this information effectively, and make your slides less wordy and more fun to look at.
Whether you’re looking for inspiration or already have a clear idea and need to prepare slides, consider some of the operational marketing decks we’ve recommended here.
Get any of the graphics you see below – click on the slide pictures to see and download the source collection. Check the entire collection of marketing PowerPoint templates here (explore for more slide decks).
These six PowerPoint templates will help you create high-quality presentations and illustrate various operational marketing topics in a professional way:
- Media planning and strategy
- Web analytics report
- One-pager company leaflet
- AIDA model
- Sales funnels and pipelines
- Survey results and report
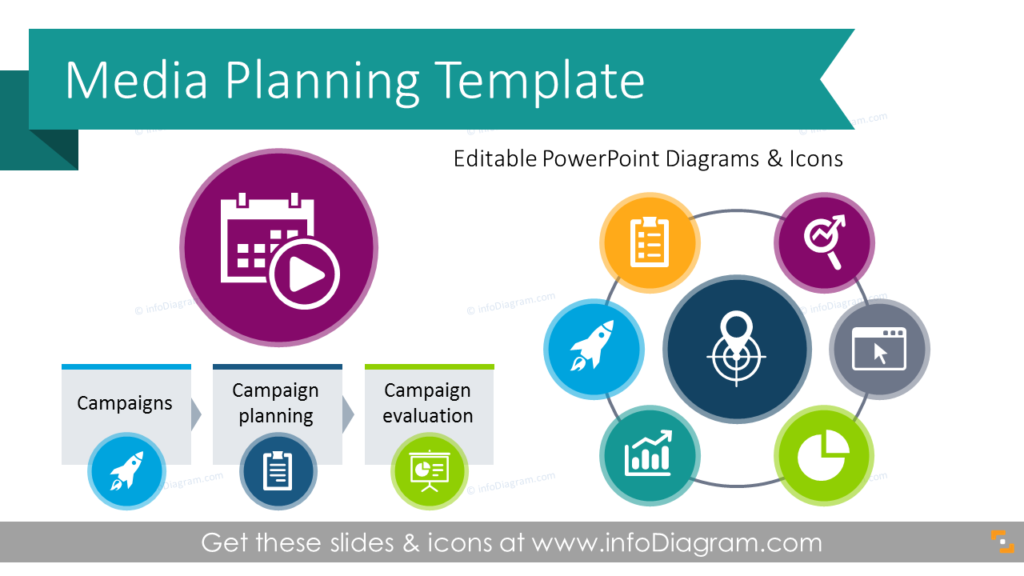
Media Planning Presentation Diagrams
Understanding how, when, and to what audience a branding or advertising message should be delivered, and finding the best combination of media to achieve the client’s objectives is crucial to reaching marketing goals.
The media planning template includes slides for illustrating user profiles, marketing advertising strategies, media scheduling plans, the process of purchasing digital and other public or social media presence, and more.
Want to remind your team of your company’s sales avatar before diving into the strategies and tactics? See ideas on visualizing the concept of buyer personas.
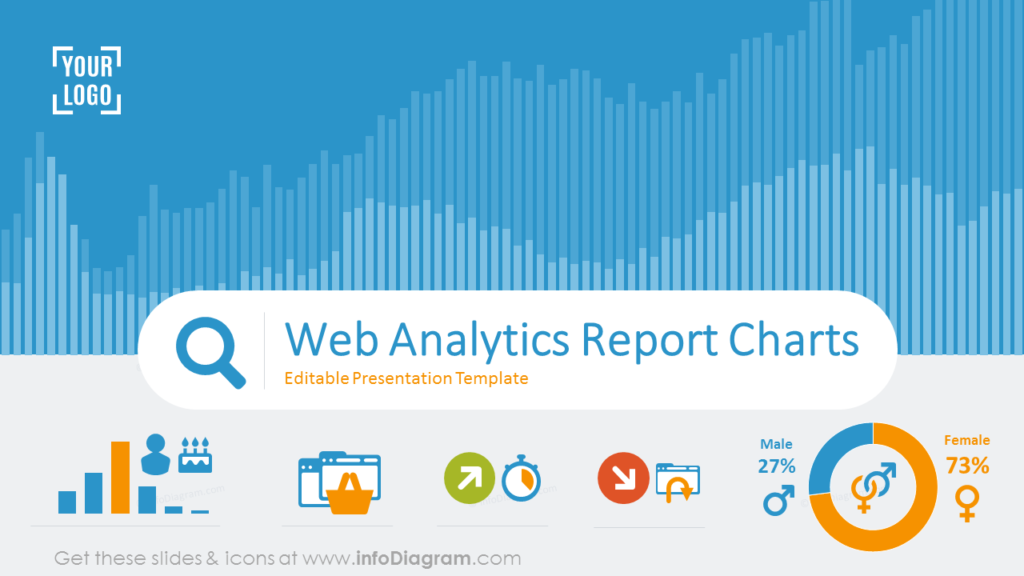
Web Analytics Report PowerPoint Charts
If you are analyzing digital marketing performance, you will deal with slides that usually contain multiple traffic data series. Presenting all technical data details may be overwhelming for the audience or readers of your report. If you want to present website data analysis, statistical figures, or digital marketing campaign effects, using clear and consistent charts along with visual explanations is key. Check an example of this Web Analytics PowerPoint Report Template has several of these elements you can reuse for your case.
You can use these infographics to:
- Present traffic sources
- Share the analysis of webpage audience: visitors’ sources and their behavior
- Visualize successful and failed actions
- Display an executive summary of the main outcomes
- Conclude with recommendations based on successes and failures analysis
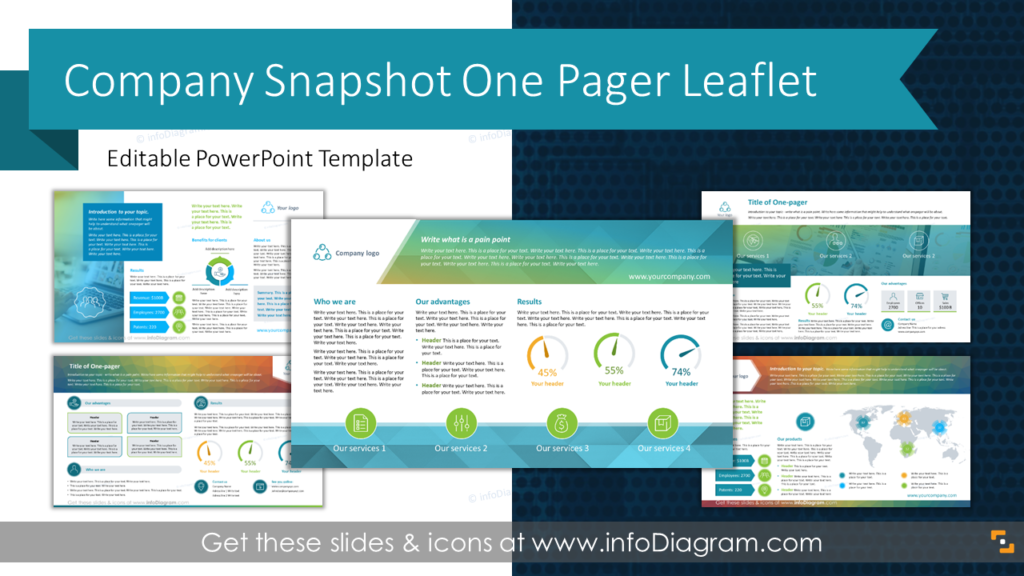
Company Snapshot One-Pager Leaflet PPT Template
One-page brochures are a versatile and effective way to inform people about your business and give a general overview of your company in a brief format, instead of a long sequence of slides. And PowerPoint can be a good tool for making such a leaflet format.
One-pager snapshot informs the target audience of what the company is doing, what are the key facts, financial profile, and contact information. Since it usually contains lots of text, it’s essential to organize it in an easy-to-follow way. Our collection includes various slides you can choose from depending on what data you’d like to show on the slide:
These templates can be used by:
- Marketers who want to present products, services, or ideas.
- Small company owners who want to make a first impression by pitching their business information.
- Managers and trainers to show the results of the project in a brief attention-grabbing designed document.
- Anyone who wants to summarize business overview, product, or service information on a single page.
Such a one-pager can also be used to illustrate nutrition or physical products in a brief format.
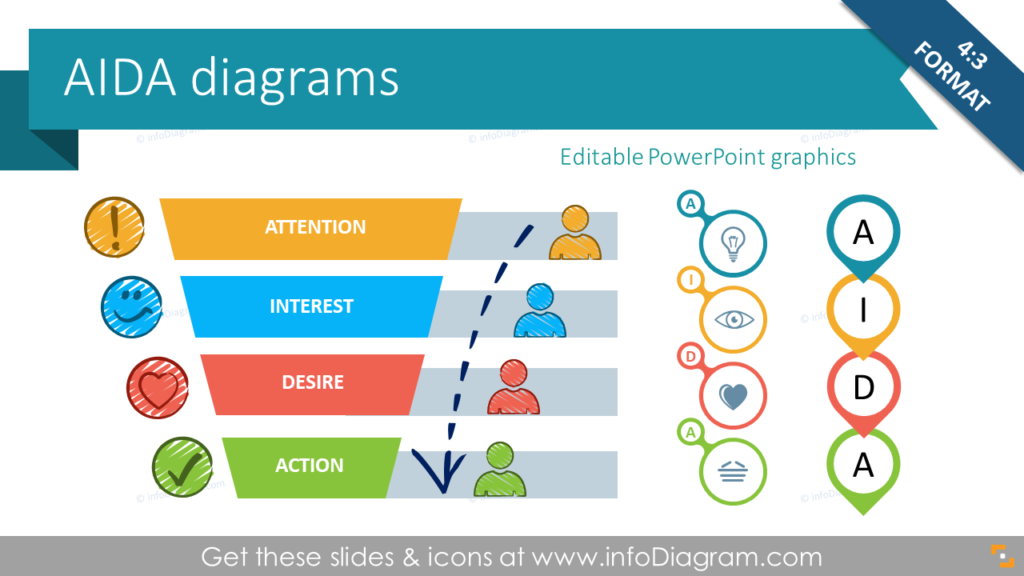
AIDA Marketing Model Diagrams
The AIDA model describes the four stages a consumer goes through during the buying process before making a purchasing decision. Use AIDA diagrams to introduce this marketing and copywriting model to your team, present an overview of activities to draw people’s attention, generate interest, stimulate desire and provoke action.
If you’re looking for ideas on how to illustrate other classical marketing models, such as marketing mix, SWOT, PEST, or Porter’s Five Forces, you can find more inspiration on our blog.
Pipeline Process and Sales Funnel PPT Diagrams
Purchasing funnel visualization is used very often in operational marketing presentations to illustrate the leads generation, conversion percentage, and customer journey in general.
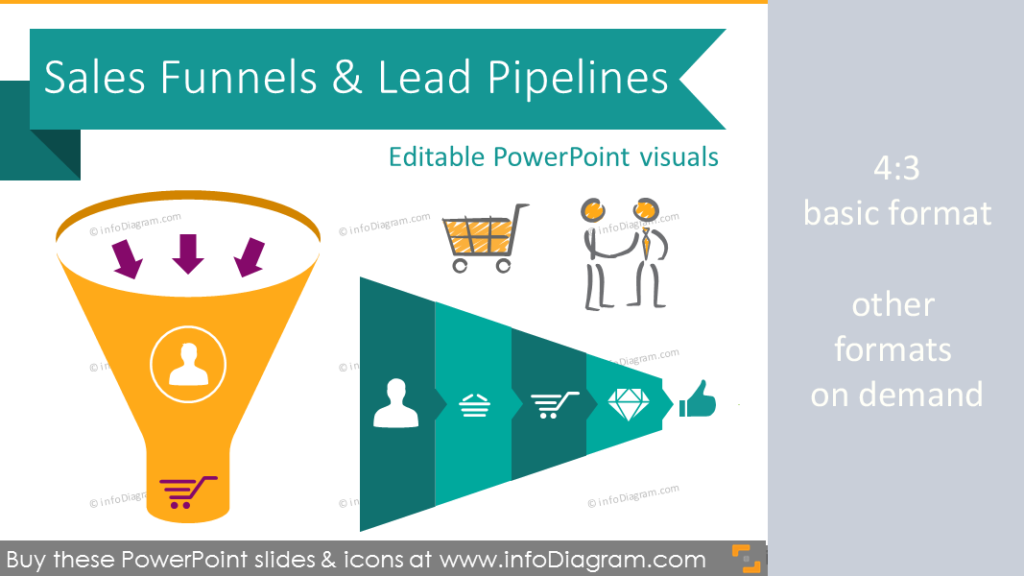
The sales funnels PPT flowcharts can be used to:
- Map out the journey potential customers go through on the way to purchase
- Analyze retail marketing funnel performance
- Present and Improve an e-commerce conversion optimization funnel
Survey Report PowerPoint Graphics
If you need to present survey results after conducting a poll or user tests, visuals can help you visualize this data in a non-cluttered way. Such reports usually contain lots of statistical data, so you can use the survey report template and its editable PPT graphics to make an easy-to-follow poll summary to get your message across.
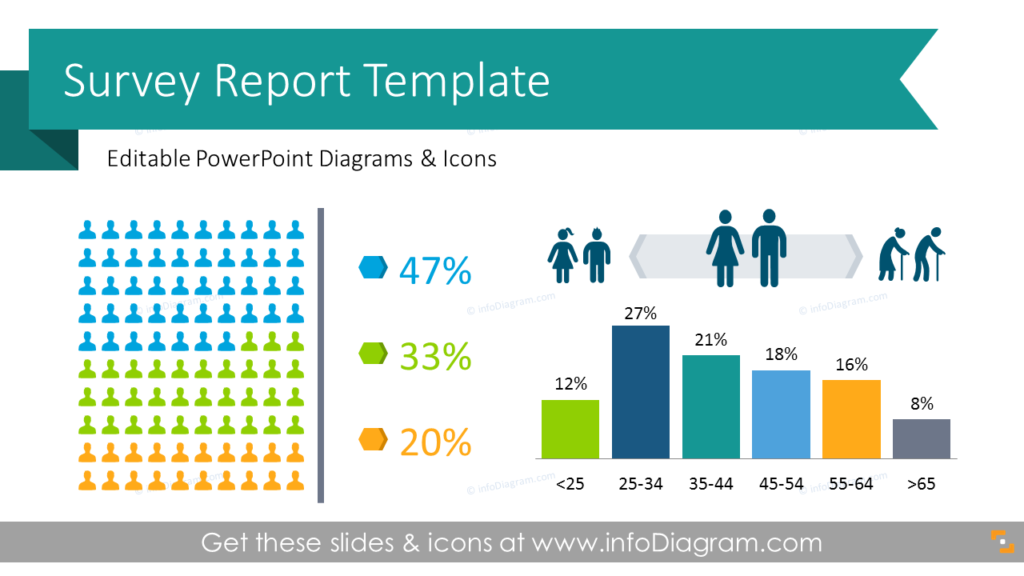
Survey report slides can be used to:
- Summarize objectives, conclusions, and recommendations
- Illustrate specific poll survey reports details: methods, results, or consequences
- Present analysis of poll participation activity taking into consideration occupation, age, or gender
- Show the geographical reach
- Show public opinion: questions & answers with percentage data
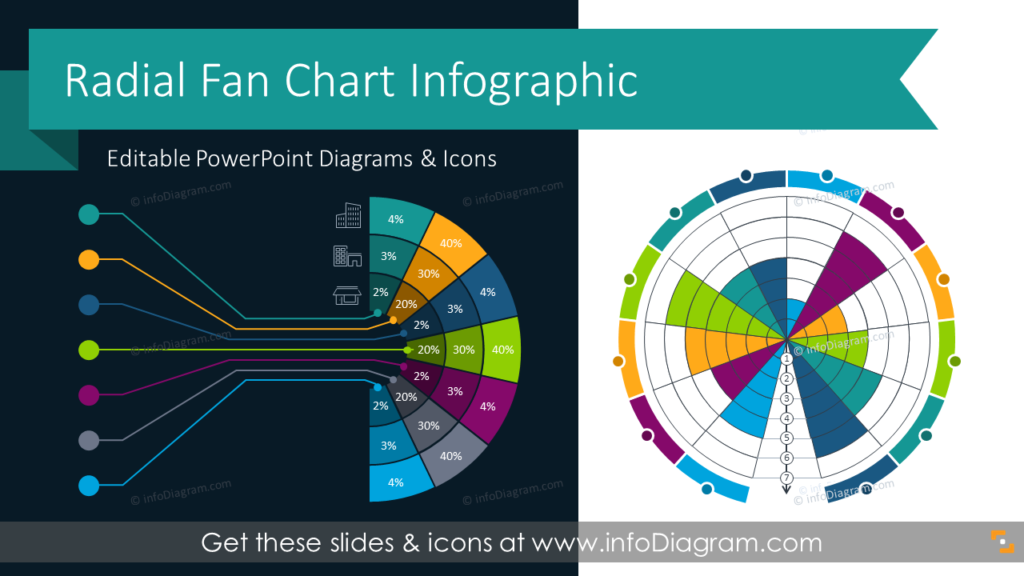
You can also use radial charts to visualize survey results, industry trends, and more instead of using default pie diagrams.
Summary of the essential graphics for operational marketing presentations
To make your slides less cluttered and thus more professional-looking, try adding visuals to your next presentation.
Having a set of customizable presentation templates can make your marketing work easier. It can speed up your work and ensure one professional level of communication with your peers.
They shouldn’t necessarily be complex, you can start with transforming bullet points into visual diagrams and adding some icons. Pre-designed graphics can help you save time and focus on presentation content.
Just make sure to follow consistency rules and align elements in a proper way so your audience stays focused.
Resources: PowerPoint Decks to Use for Operational Marketing Presentation
All slide collections from above, and many more, are available on our page. Explore the set of presentation graphics on marketing reports, strategy, analyses, and planning topics:
To try out how those visuals work, get a sample of free PowerPoint diagrams and icons that you can use to see if this kind of presentation graphics is a good fit for you.


