How to Create a Memorable Supply Chain Process Presentation Using PPT Visuals

There are situations in reporting supply chain topics when you may want to illustrate complex processes in a digestible and memorable way. Conveying massive amounts of data in the form of lists and tables is not enough in such cases. Converting from a word-based to a more visual presentation tends to help in fast scanning, understanding, and memorizing information. This method seems especially effective when showing flows and dependencies, which are the core of the logistics and supply chain process. 

Continue reading How to Create a Memorable Supply Chain Process Presentation Using PPT Visuals

4 Recommended Graphic Sets for Your Supply Chain & Logistics PPT Presentation

Managing supply chain operations, trying to choose the right supplier, or having to explain logistics concepts? You don’t have to use whole paragraphs when you’re presenting; instead, you can use visuals and infographics to help you cut down on unnecessary content and engage your audience more. All while saving time so you can work on more pressing tasks. Leading on from that, have a look at these 4 templates for logistics presentations we recommend for supply chain managers and similar professionals.

Continue reading 4 Recommended Graphic Sets for Your Supply Chain & Logistics PPT Presentation

How to use Value Chain Model Presentation Diagrams

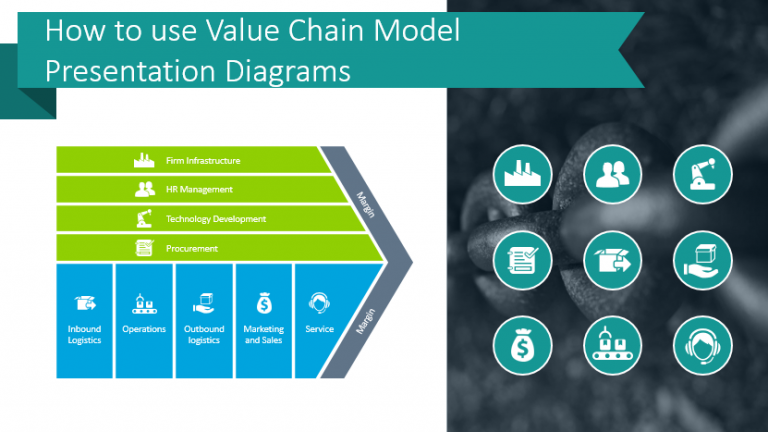
Do you need to explain the value chain model? If you’re conducting business using the value chain model, you can do so with visuals. Flow charts can be immensely helpful when breaking down the value chain consulting approach. Explain how the value chain model serves to evaluate company activities which deliver a product or service directly to the end client.

Continue reading How to use Value Chain Model Presentation Diagrams

Using 3D Supply Chain Vector Icons for Realistic PPT Illustrations

Why use 3D icons in a presentation?

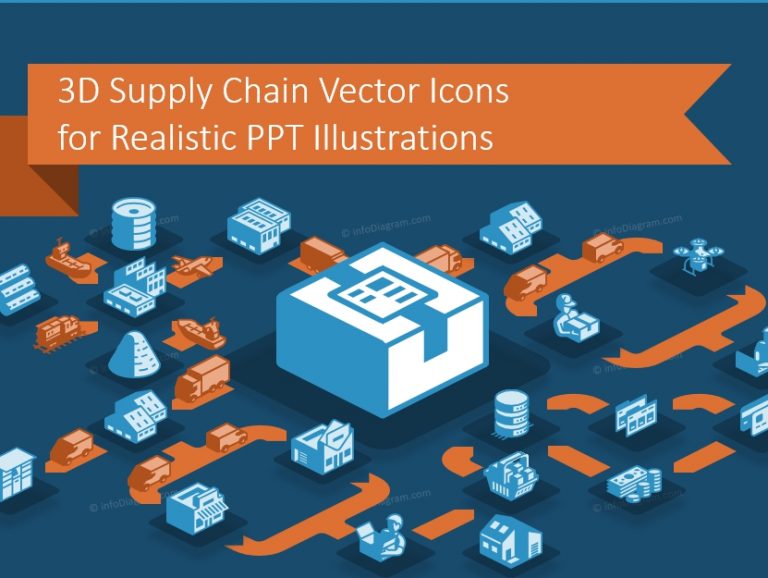
3D logistics icons are useful for creating realistic presentation flowcharts. These so-called isometric icons allow you to present various logistical processes close to a real three-dimensional view of objects from above. If you’ve seen our posts about flat icons (Simple Flat Icons for Infographics Presentation), you’re familiar with the way imagery can help you explain logistics. You may also be wondering what makes a 3D icon better than a 2D icon, or whether there is a difference at all.

Continue reading Using 3D Supply Chain Vector Icons for Realistic PPT Illustrations

Illustrating Supply Chain Presentation

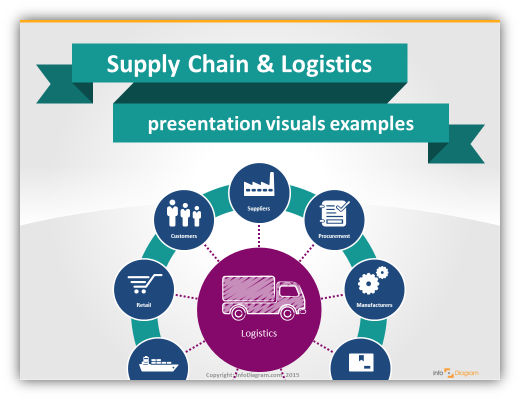
The topic of Supply Chain is pretty complex – with all global or local logistics processes, ensuring just on time delivery and enough stocks in warehouses. Therefore using illustrations to explain it is really handy. Good news is that most SCM processes are easy to visualize. We gathered a few examples of how you can illustrate a supply chain presentation. Easily and quickly, using only PowerPoint tools.

Continue reading Illustrating Supply Chain Presentation