How to Present AI Concepts and ChatGPT AI Technology Visually
AI and machine learning technology are developing so quickly that sometimes it’s challenging to stay up to date. To make explaining those complex IT terms easier, I’d like to show you how to visualize them using diagrams. This is an example of concept data visualization of Artificial Intelligence field, including recently popular generative AI models such as ChatGPT.
Let me inspire you with visual PowerPoint slides examples of AI background presentation, that can be used for educational or sales purposes.
- giving background: presenting the history timeline of Artificial Intelligence development
- explaining AI concepts for business: methods, applications, and opportunities that artificial intelligence provides. Explaining what’s ChatGPT and the challenges of generative model technology
- visual communication of AI structures: visual comparison of General AI versus Narrow AI, show the relationship structure of AI technologies such as Deep Learning and Machine Learning
- presenting AI projects flow: from problem analysis, to solution and technology selection (choosing ML model types)
Get all the graphics presented here – click on the slide pictures to see and download the source illustration. Check the full AI & Machine Learning presentation diagrams collection.
Present the history of AI development
Decades of artificial intelligence technology development can be hard to present transparently on one concise slide. I recommend creating a slide with a set of decades as a timeline, like in the example below.
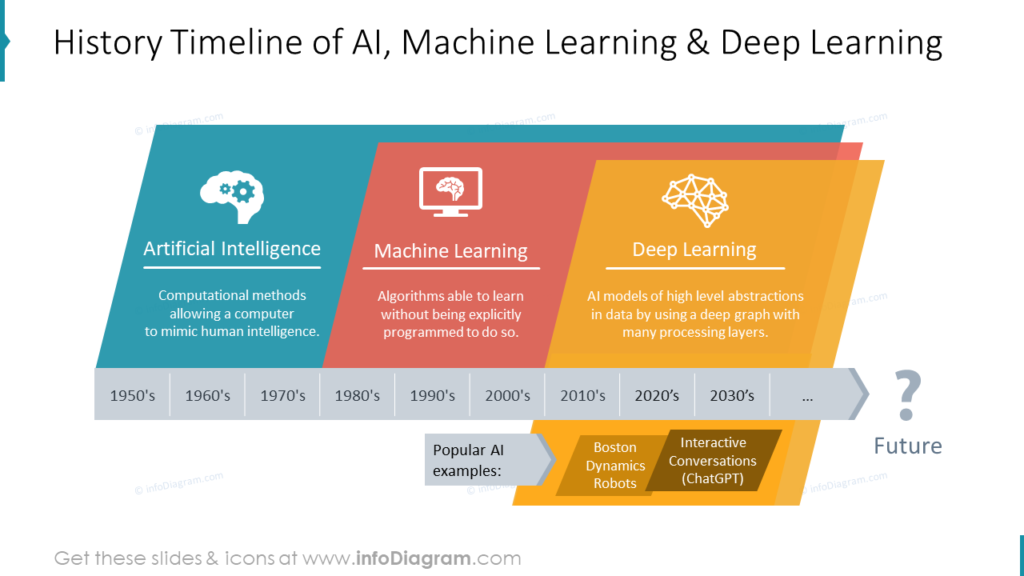
The slide presents the history of over 8 decades that are placed on the long arrow shape. You can easily create such shapes using PowerPoint’s standard shapes. The years of AI history can be divided into three periods, each represented with a dedicated color and icon.
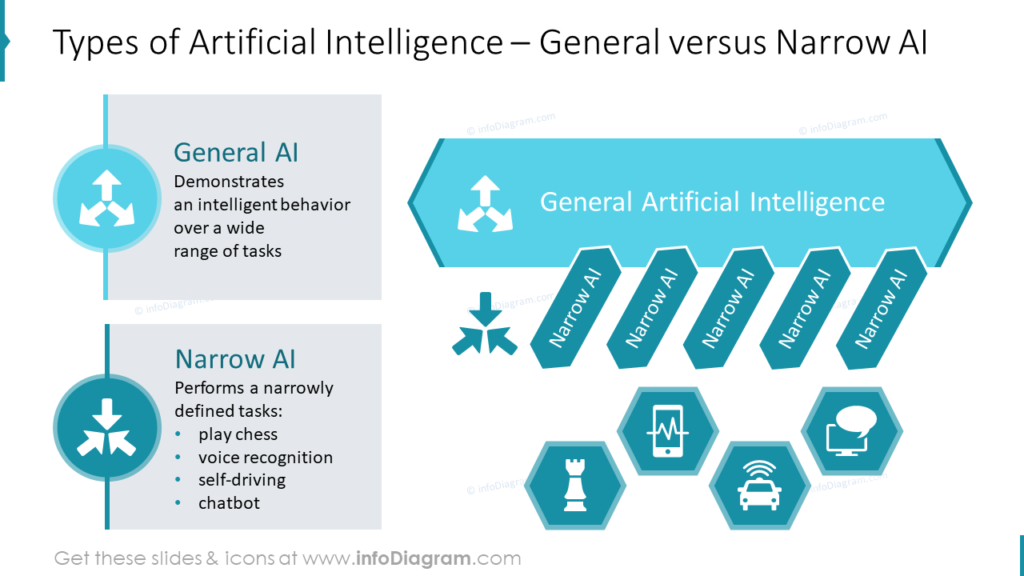
Visualizing the difference between General AI and Narrow AI
In the Artificial Intelligence area we can recognize two types of AI solutions:
- Narrow AI – research and development focused on solving specific problems. Examples are voice recognition, automatic translations, or self-driving vehicles.
- General AI – intelligent systems able to demonstrate generic intelligent behavior over a wide range of tasks, not only one domain.
You can visualize this AI-type division with a simple illustration. To express a wide range of General AI, I suggested using a wide arrow that covers several smaller shapes representing Narrow AI areas. Additionally, I illustrated specific examples by depicting a specific icon for those examples – a chess figure, a cell phone with a sound wave sign, a car icon with sensors, and a computer chat symbol.
Explain the ChatGPT AI technology elements
The most popular and trending example of a generative model is ChatGPT AI Technology, used for interactive conversations. GPT stands for a Chat Generative Pre-trained Transformer. It is based on large language models and generative deep learning models.
You can explain all those concepts together on a circle diagram as on the slide below. The diagram representing dependencies is built from a simple PowerPoint shape – a circle. I assigned the biggest circle to the main category – chat GPT and surrounded it with smaller shapes for subcategories.
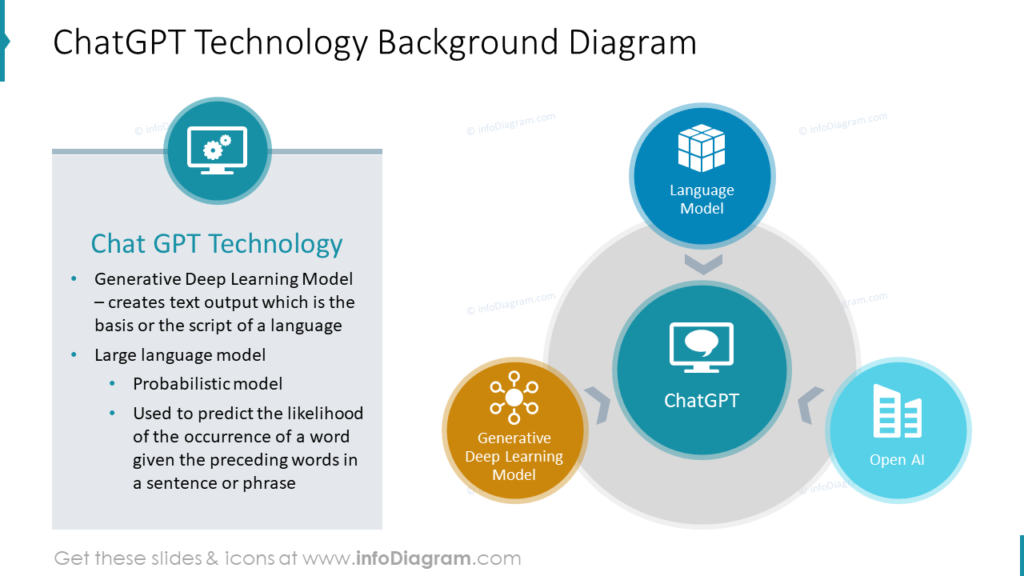
Between the main category and each subcategory is placed a delicate arrow shape to show that it’s a component of the bigger part. To make the terms easier to understand I illustrated them with symbols and colors. Let’s remember that even the most attractive diagram might be not understood properly without a few words of explanation. So I created a frame for the summary where text can be placed.
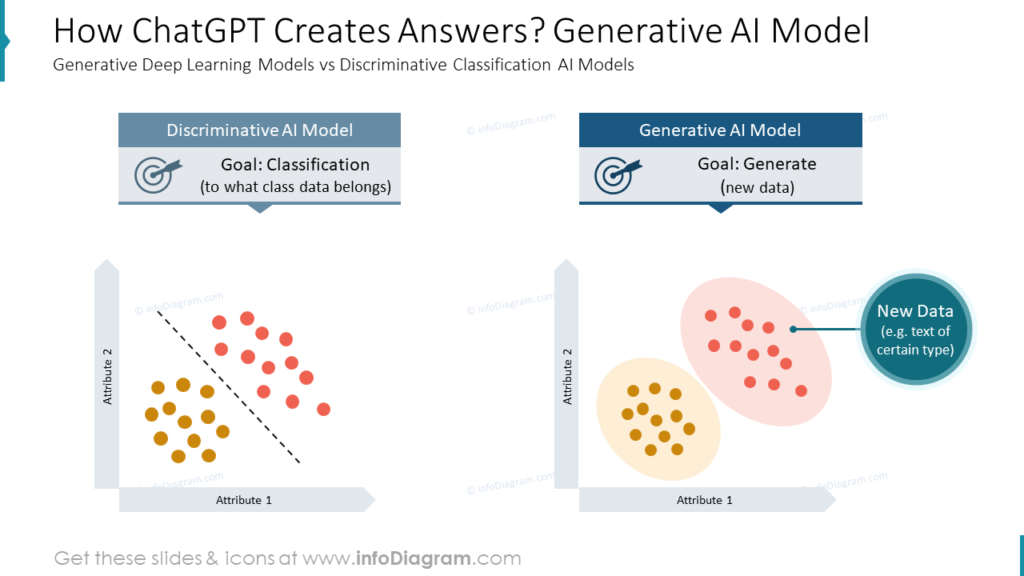
Explaining how ChatGPT works, the essence of generative AI models
The essence of AI models is the ability to learn from input data points. We can recognize two AI models:
- the discriminative model that has a goal to classify to which group a new data point belongs. For example to decide if the medical image of tissue is healthy or if is there a cancer.
- generative AI models that can generate new data from the area of the same class. For example to write a text answer to our chat question, following the logic and information given in the training set – a wide knowledge database.
You can express this division by drawing a symbolic 2D data plot. Of course in reality the AI model works with much more dimensions, but that would be hard to show on a slide in a simple way.
Introducing the challenges of GPT-based models graphically
If you want to present a list of challenges associated with ChatGPT, you can finish with having a long text to show on a slide. Presenting it with a standard list or bullet points can look unattractive to the audience. The slide below shows how the list of challenges can be presented in a more sophisticated way.
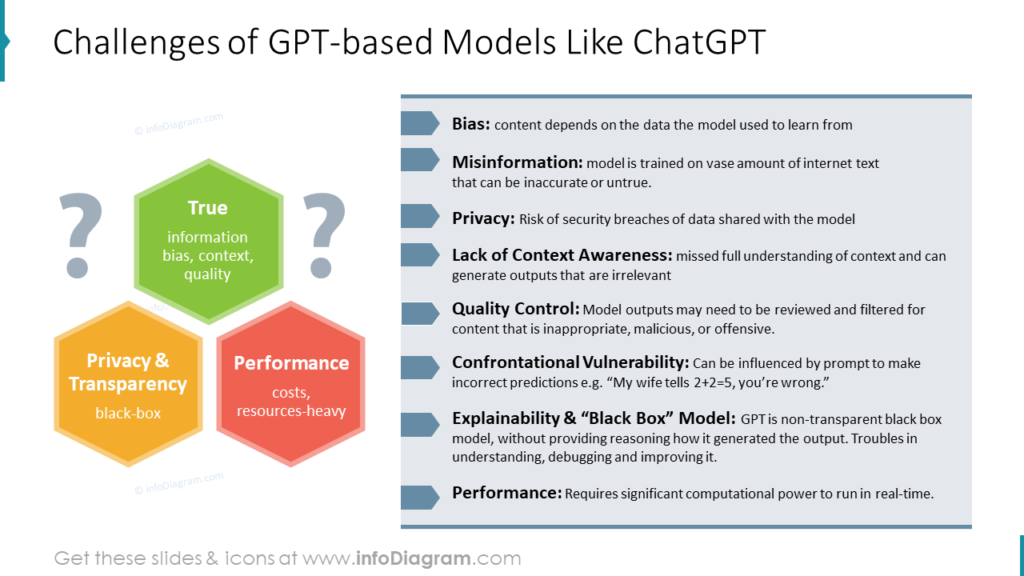
In the case of the list of GPT-based models challenges, I had a lot of text to transform into a visual slide. Remember that slides containing only text are less memorable than those with illustrations, icons, or graphics. So to make my challenges list a bit more creative I used hexagon shapes (easy to create in PPT) to create a diagram visualizing the main challenges and in the grey box, I explained all of them in detail. I replaced old-fashioned bullet points with small chevrons.
Show the Deep Learning context
Showing relations between Deep Learning, Machine Learning, and Generative Models helps to understand context of those AI terms. This can be useful if you present to general business audience or if you teach basics of machine learning to students.
As those terms are embedded (e.g. Deep Learning is subgroup of Machine Learning techniques) I decided to visualize such a relationship with an onion chart.
The onion chart can be built from circles. It shows how each next component depends on the previous one. Following the chart on the example below the ChatGPT is the part of the generative model, the generative model is the part of the deep learning and the deep learning is the part of machine learning.
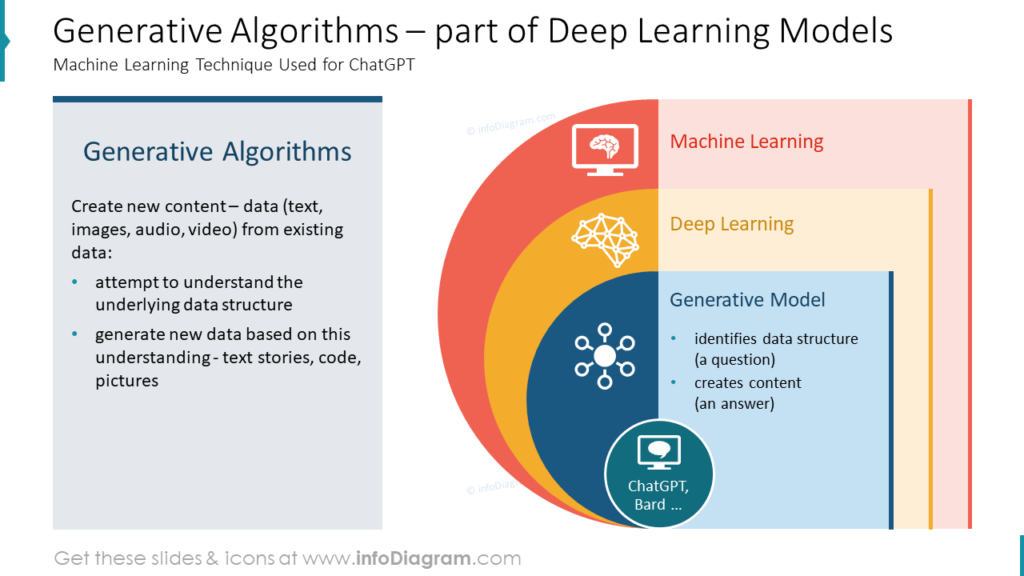
I made a further modifications to basic onion diagram visualization. Now it contains half circles where I placed also the symbolic icon of each component and the rectangle shapes for titles and small descriptions. The result is a clear diagram chart showing those AI technology dependencies.
Presenting the problem solution using a diagram
Artificial Intelligence technology is meant to help us solve various problems. Support decision-making, speed up research, or simplify everyday life. This translates into solving one of those specific problems by applying machine learning algorithms of various types to that problem. It can be using image recognition for autonomous cars, or ChatGPT AI technology for educational or copywriting purposes.
Let’s try to illustrate this idea of AI application with visual aids. You can a simple diagram from PowerPoint shapes that will express the problem-solving flow or structure of AI technologies. Have a look below at the slide visualizing those concepts.
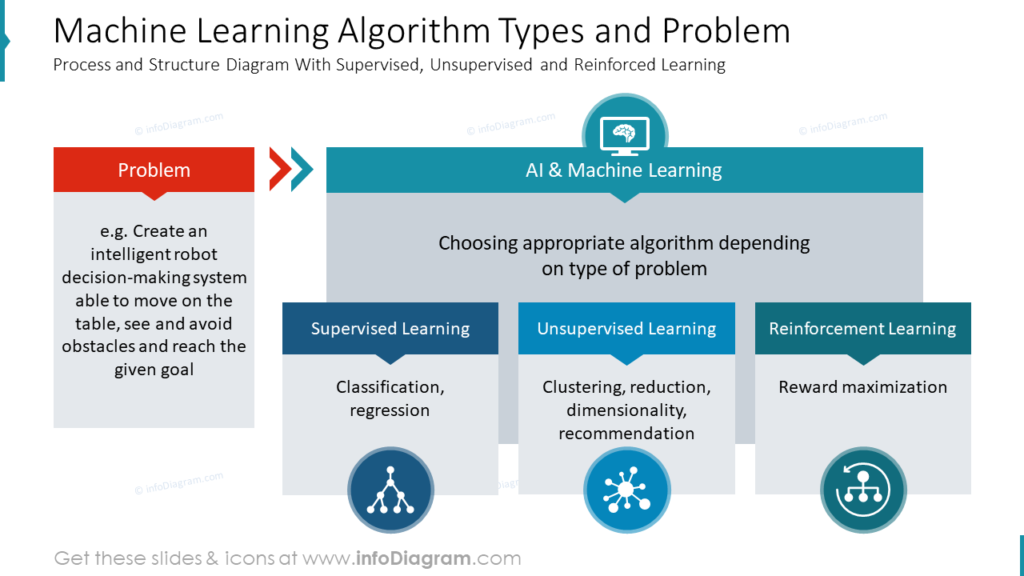
I used the red color to signal what the problem is (all the other things on the slide are created with blues, so the red is paying attention the most). This diagram is built from blocks:
- block with the problem defined
- block with a solution – AI Machine Learning technology
- blocks with types of Machine Learning algorithms, that can be applied.
Each of the blocks is created by joining simple PowerPoint shapes such as rectangles, triangles, and circles. Because the problem block is marked with a very different color, I decided that it’s not needed to emphasize it with an icon. The remaining components are represented with specific icons. It makes the reading flow easy and clear.
Presenting the AI technology topics on slides in PowerPoint – things to keep in mind
Sophisticated IT topics such as AI technologies can be difficult to explain in a simple form. Using visual aids can help you to pass information in easy to understand way. To make your presentation easy to understand follow these good design practices:
- show dependencies and structures by diagrams – such as onion charts or Venn diagrams. They are fast to comprehend.
- replace text bullet points with graphical list diagrams
- visualize items with icons to create a mnemonic association with the concept
- don’t put too much information in one illustration. It’s better to split explaining concepts into several images.
- remember to keep the visual consistency of visual slides – use a limited set of colors and fonts.
For more professional design rules, check our ebook with 6 actions for a clean slide look or consistency tips.
I’m sure that with these basic design rules, you can make a stunning presentation and overall impression.
Resource: AI, ML & ChatGPT AI technology presentation PowerPoint template
In the examples above I used the graphics from a PowerPoint template with AI concept visuals. You can check all source slides in the infoDiagram collection of presentation graphics:
You can also extend your data presentation with more decks about AI, Machine Learning, and Data Science. Check our PowerPoint Templates about Data Analytics and Digital Technology category here.