Creating Engaging Town Hall Meeting Presentation in PowerPoint
Are you looking to effectively provide updates, share information, and facilitate engaging communication with your employees during a town hall meeting presentation? As part of that, it’s essential to present updates and deliver presentations in an engaging manner. To assist you with this topic, I have prepared a few slide examples that you can incorporate into your presentation.
Let me inspire you with visual PowerPoint slides examples of company Town Hall meeting presentation:
- explaining what’s town hall meeting about
- presenting a team growth
- visualizing the key achievements and milestones on a roadmap
- presenting creatively the mission, vision, and values statement
- visualizing the data on a dashboard
Get all the graphics presented here – click on the slide pictures to see and download the source illustration. Check the full Town Hall All-hands Meeting Presentation.
What is the town hall meeting?
The town hall meetings, also known as “all-hands” meetings, are gatherings where the team can hear the news, discuss challenges, stay informed, and offer ideas. They are an opportunity for employees and leadership to come together as a team, engage in open conversation, and share updates, successes, and any queries that have cropped up along the way.
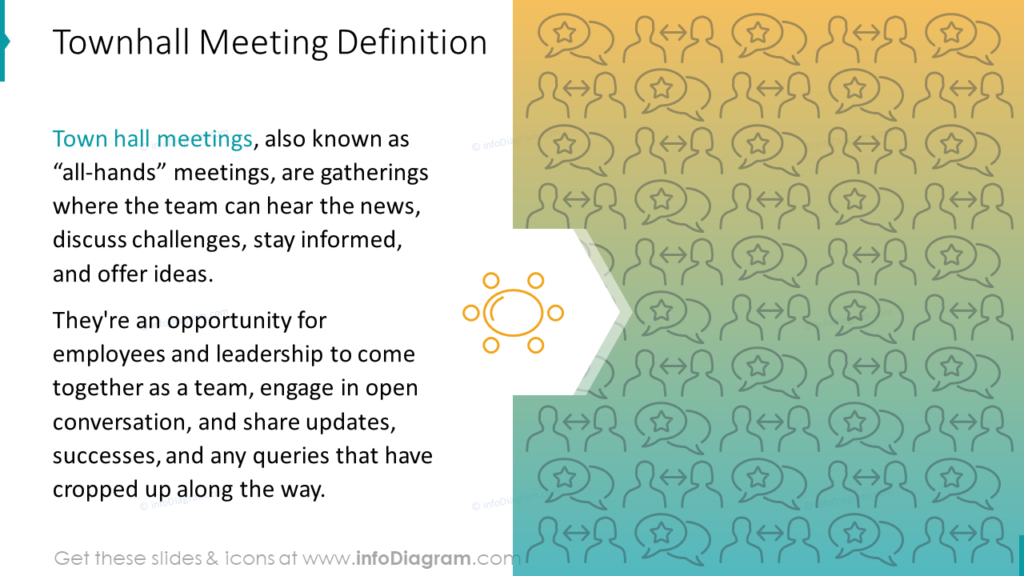
In case you have newcomers at your meeting, you may want to present such definitions creatively on a slide. I prefer using a two-column template to present such definitions. This allows for a combination of text and graphics. In the example above, I used a gradient background and icons, but a photo can also represent the graphical component.
Presenting a team growth graphically
When you want to talk about team growth this topic can include such focus areas:
- new benefits for your employees
- work-life balance support
- personal development or PDP support activities
- team building events
- other empowerment of your team
To illustrate these areas, you can use a growing plant metaphor. Take a look at the slide below.
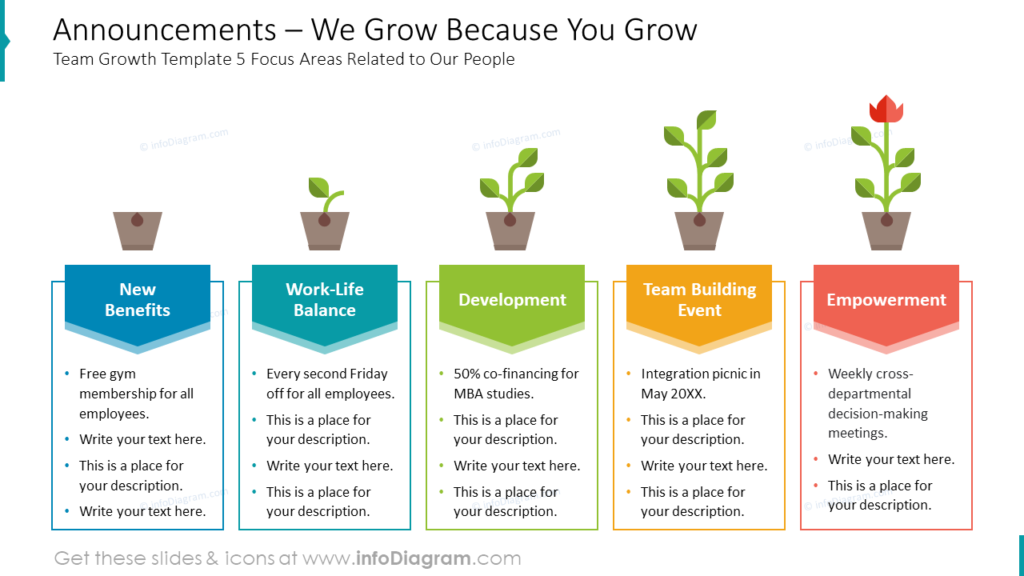
Each area of the team’s development is illustrated with a plant’s growth from a seed to a flower. To further highlight the stages, each of them is enclosed within a text box and assigned a specific color. It is important to arrange the boxes evenly on the slide to maintain a balanced layout.
If you’re about to focus more on business growth strategy and your plan for increasing your company’s markets and revenues, check out our blog.
Why use a roadmap to present the key achievements and milestones
Utilizing a roadmap visualization aids in enhancing the audience’s understanding of key milestones along the path to success and effectively communicates the implementation of new procedures.
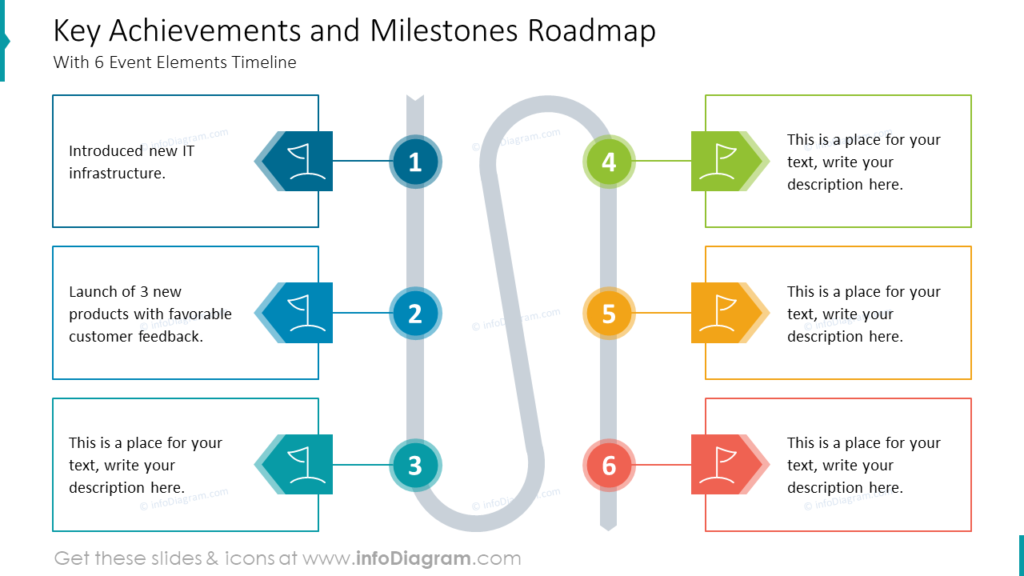
To create such a slide, I used shapes available in PowerPoint such as rectangles, circles, and chevrons. Each number on the roadmap is assigned to an appropriate box, which includes a description and a flag symbol to create an association with targets along a road.
How to present the mission, vision, and values statement creatively
It may be worth reminding the core values and directions in your town hall meeting presentation.
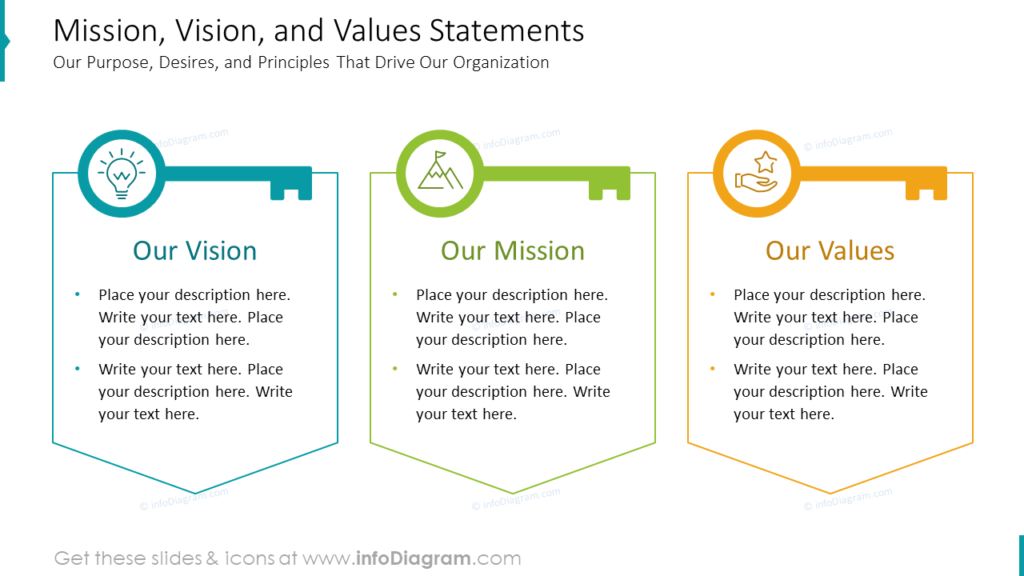
Simply covering a slide with plain text to explain your company’s vision, mission, and values can be dull and difficult to remember. It is better to create visually interesting shapes that capture the audience’s attention. In order to emphasize the significance of unlocking the full potential of our core values, I have used a key symbolism. Furthermore, each statement is enriched with a specific icon to enhance the slide’s relevance.
- a bulb for a vision statement
- a top of a hill for a mission statement
- a hand with a star for a values statement
Visualizing the data on a dashboard
It’s highly likely that you will need to present data during the town hall meeting. However, it’s important to avoid boring your audience with dry numbers. To make the data more engaging, I have created a two-column dashboard slide to effectively present sales-related information.
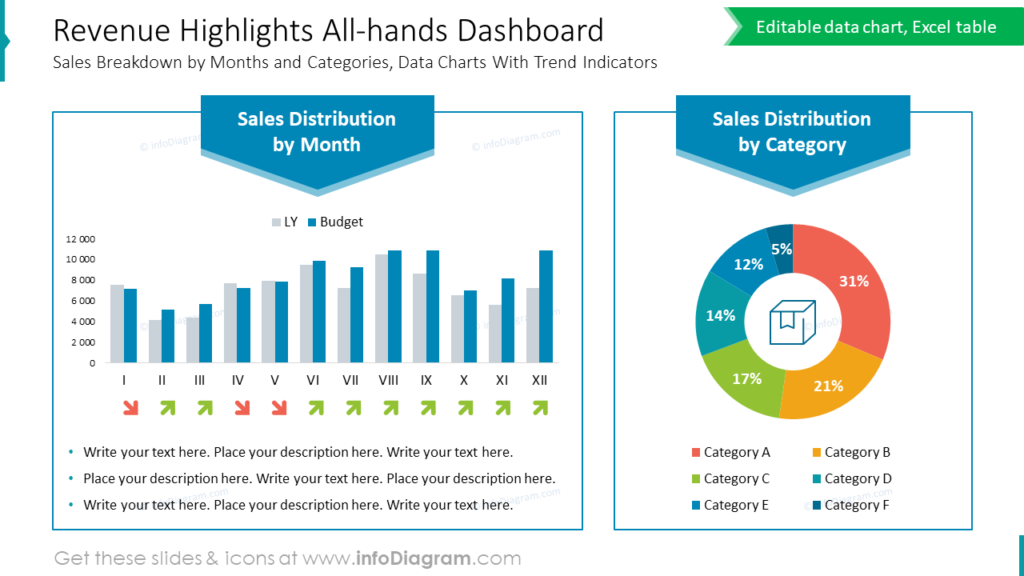
The left column displays data using bar charts, with arrow icons highlighting monthly increases and decreases. The downward red arrow represents a decrease, while the upward green arrow symbolizes growth. On the right side, I have included a donut chart, which is similar to a pie chart but more visually appealing due to its ring shape (allowing for a representative icon in the center). The pie chart is color-coded, making it easy to identify each category assigned to it.
If you need to squeeze much data into one slide, see how data dashboards can help to illustrate data reports.
Making Town Hall Meeting Presentation Visually Engaging – What to Keep in Mind
Because town hall meeting is so important event, presenting it requires engaging and visually appealing slides to captivate your audience. Just keep in mind a few rules from our graphic designers:
- incorporate creative visual aids instead of relying on plain text
- go beyond simple slide layout, try arranging content into more columns to use the full space of the slide
- elegant gradient backgrounds, photos, and icons can convey information in a visually engaging manner
- draw attention to significant aspects of your message with icons or arrow indicators
- arrange data into a clear dashboard chart layout to present information in a readable and attractive manner
I’m convinced that by incorporating these creative ideas and design tips into your slides, you can elevate the impact and engagement of your town hall meeting presentation.
Resource: Company Town Hall Meeting Presentation PowerPoint Template
In the examples above I used the graphics from a PowerPoint template with Town Hall Meeting concept visuals. You can check all source slides in the infoDiagram collection of presentation graphics:
If you want to include multiple data charts and KPIs in your presentation deck, extend your town hall meeting presentation with data dashboard layouts.


