How to Create a Compelling Presentation on Business Growth Strategy
Do you need to present how your business is growing, what’s your plan for increasing your company’s markets and revenues? Presenting business growth can be a daunting task, but with the right approach, you can create a presentation that effectively communicates your company’s progress and potential. Whether you’re pitching to investors or updating your team on recent status, this blog will provide actionable tips and visual examples to help you create a compelling and persuasive presentation on business growth.
Creating a Growth Strategy for Your Business
As a business manager or owner, you understand that growing your business is essential for long-term success. However, developing an effective growth strategy can be challenging, especially if you’re starting from scratch. Here are a few ideas on how to create a growth strategy for your business.
Analyze the Market and Your Position
Before you can start growing your business, you need to understand the market and your position in it. Conduct a market analysis and use popular methods such as SWOT to analyze your strengths and weaknesses. Identify gaps in the market, and assess whether there are any new opportunities emerging after the pandemic years or new technologies.
Expand Existing Markets
Expanding your existing markets is one of the easiest ways to grow your business. Here are a few ideas to get you started:
- Cross-sell complementary products and services to your current clients. For instance, you can offer insurance for your products.
- Affiliate offers – find a partner that offers something related to your clients and create joint offers.
- Up-sell – offer higher-end, more quality, or more rich service options to your current clients.
Enter New Markets
Expanding your business to new territories is an excellent way to achieve growth. Here are some ideas for entering new markets:
- Open a subsidiary in a new country or similar type of market.
- Go overseas, and if necessary, consider external funding to access new big markets.
- Address new customer segments. You can follow your clients’ demographics, starting with books for babies and then expanding to school-age kids, tweens, and teens.
- Pivot – use your background and experience and try a 180-degree turn in your offering to address brand-new markets.
- Digitalization – consider moving your brick-and-mortar business to the online space. You can open an e-shop or offer additional services online. However, it is necessary to secure an e-shop with an SSL Certificate, which enables HTTPS in the address bar for a secure connection.
How to Present Business Growth Visually in PowerPoint?
Once you have worked out your business growth strategy, it’s time to prepare the slide deck that will communicate clearly your ideas to your decision-makers.
Here are a few ways how you can illustrate the concept of business growth on a PowerPoint slide:
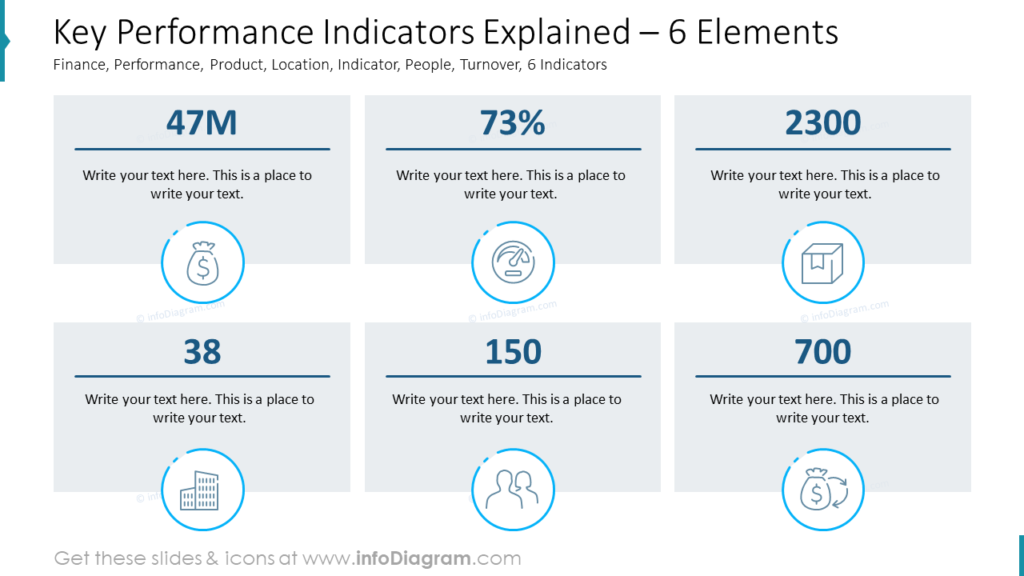
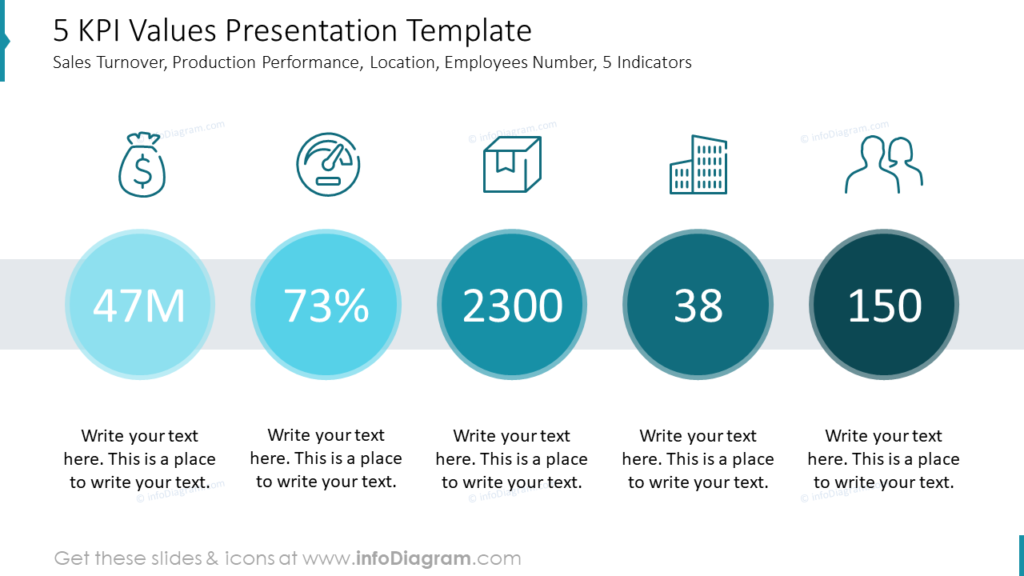
1. Present key performance indicators
You can illustrate your current state of the business and growth goals by simply presenting key sales numbers or other KPIs. This can include displaying metrics such as estimated revenues of a new market, profit, an increase of manufactured products, quality of services, number of subsidiaries, or customer acquisition numbers. Presenting one visible key value without distractions of underlying detail data, allows the audience to visually understand the growth potential.
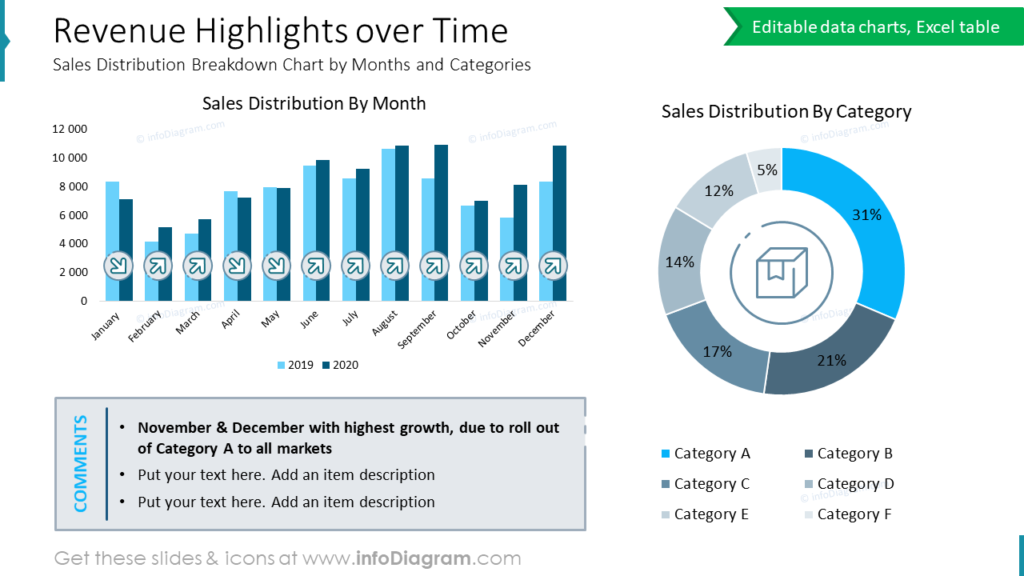
2. Show development trends with charts
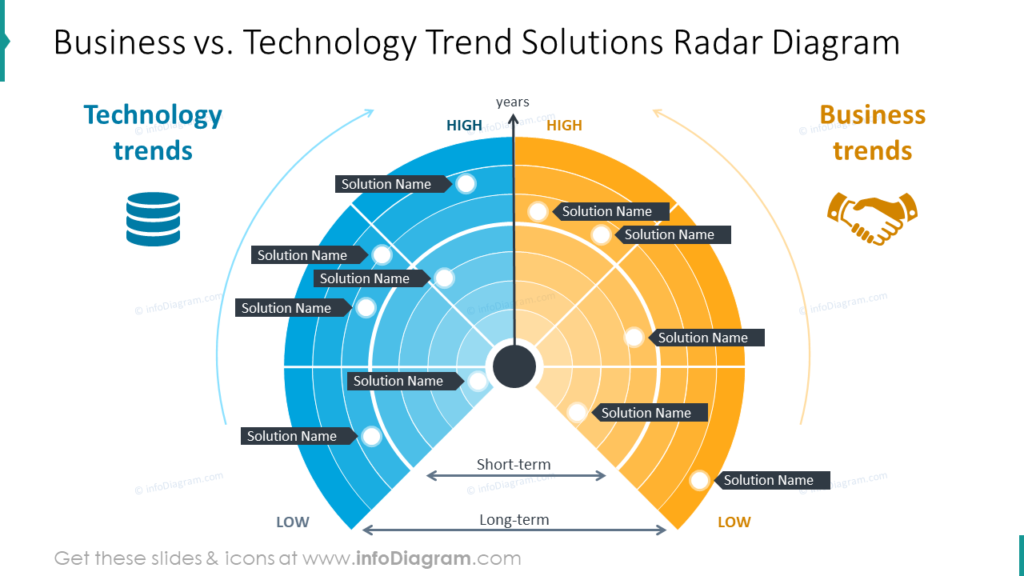
You can express a forecast of growth trends in a chart. It can be a development over time – predicting growth in the next months and years. Or presenting market trends – what solutions and technologies are to be expected in a short-term or long-term period.
For the first case, you can use a line trend chart to showcase business growth over time and present how business expansion can develop. Line charts or area charts can be used to depict the forecasted upward trajectory or highlight performance patterns from the recent past, fluctuations, and overall progress.
For showing the expected emergence of new technologies on a market, you can use a trend radar chart, as in the picture below.
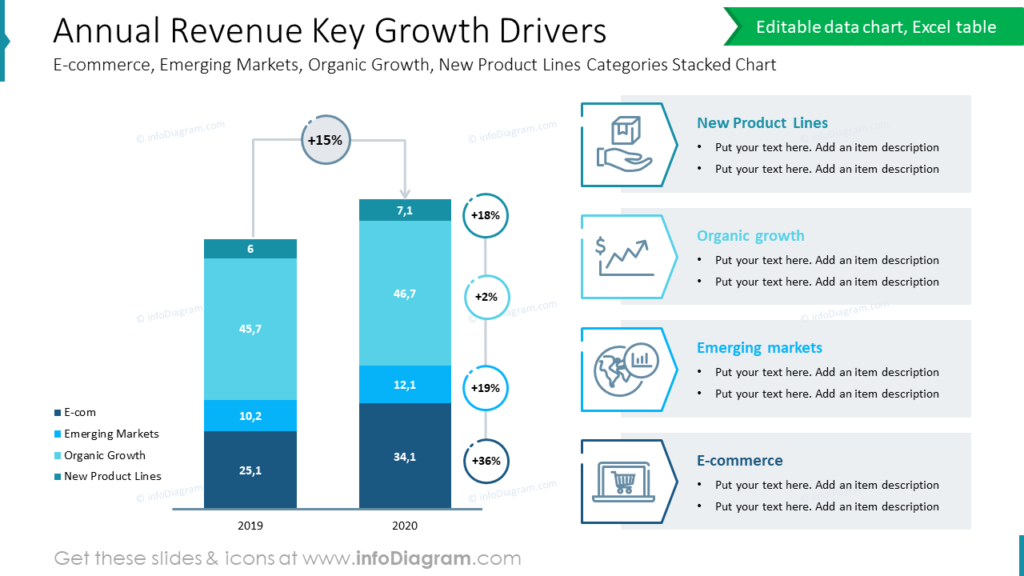
To know where you are going to grow, you need to understand the past. Analyze what were the main drivers of your last year’s growth and build on them. To present such analysis on one slide, you can use the following layout for inspiration. It presents four main revenue growth drivers examples – new product lines, organic growth, emerging markets, and e-commerce:
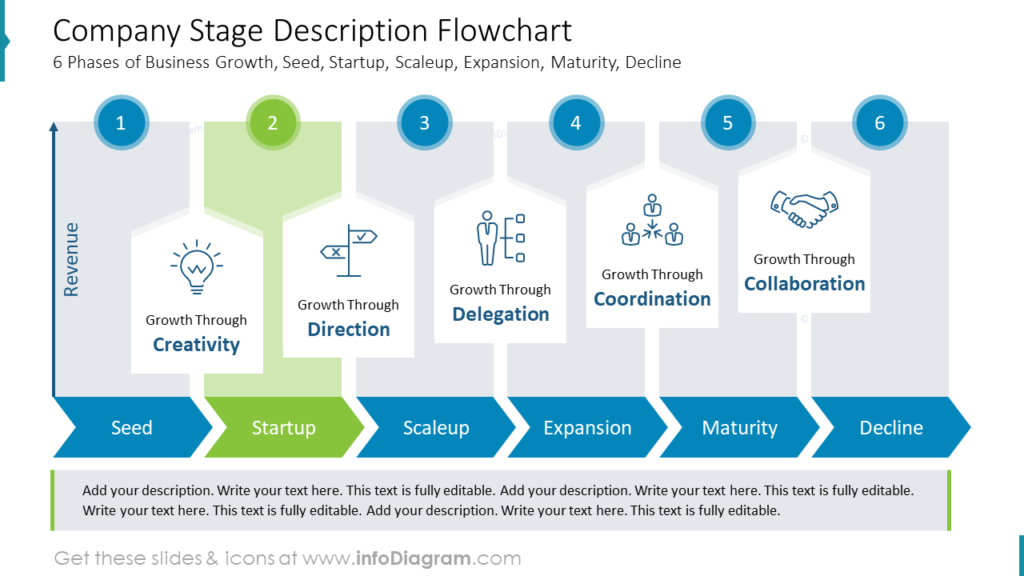
3. Using a flowchart showing growth stages
To express the steps of a company development visually, draw a flowchart diagram with those steps.
A flowchart can visually represent the different stages of business growth. By breaking down the growth process into distinct steps or phases, you can provide a clear and logical visual representation of the overall journey, and plan growth stages to manage the whole process.
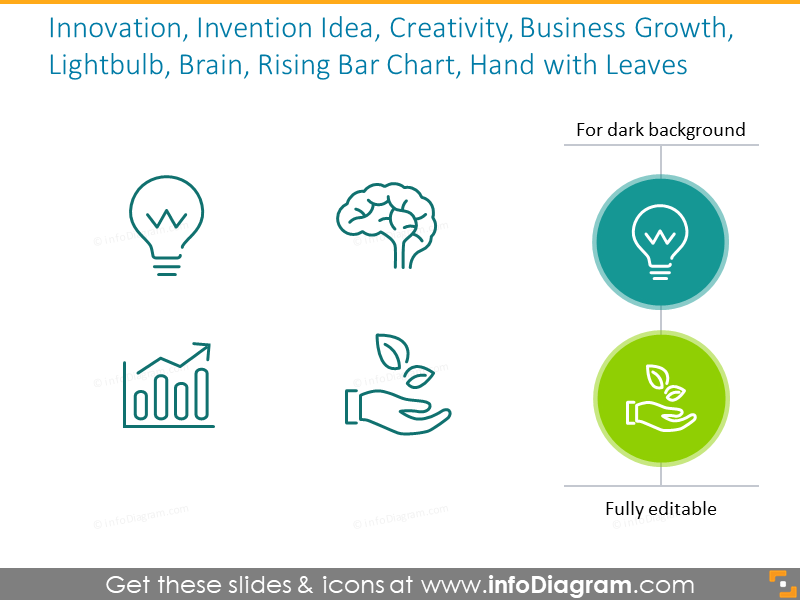
4. Express the growth idea with one symbol
When you want only to illustrate a concept of growth, consider expressing it with a simple pictogram or icon. Adding a style-neutral icon can help convey the idea of growth in a subtle yet eye-catching way.
Simple pictogram icons are a great choice when you have only a little space on a slide for graphics, e.g. you want to show that a specific item is growing. This symbol can be a graph pointing upwards, a rocket taking off, or an arrow moving in an upward direction. Such symbols provide a concise and easily understandable visual representation of growth.
See more specific ideas in our article on illustrating the concept of business growth and development here.
5. Incorporate a visual metaphor of a growth
Generic visual metaphors can be used to depict business growth in a creative and engaging way. For example, you could use images of a flourishing tree, a rising sun, or a rocket launch to symbolize growth, emphasizing the concept through visual association.

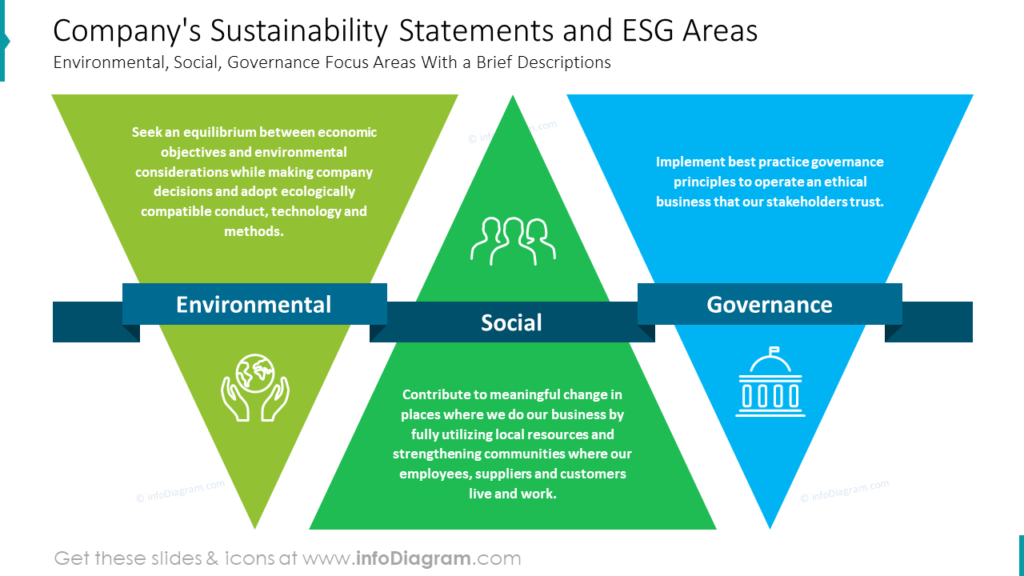
6. The bigger picture: illustrate sustainable growth
Today, in light of more and more important environmental issues, the growth should be seen also in a wider context.
The modern economy is moving towards sustainable growth. Countries and companies are adopting new approaches such as Triple Bottom Line or ESG.
Below you can see sample slides from the presentation used for ESG Sustainability Report – expressing the synergy of those three areas (Environmental, Social, Governance) that should be taken into account when planning the future of your organization.
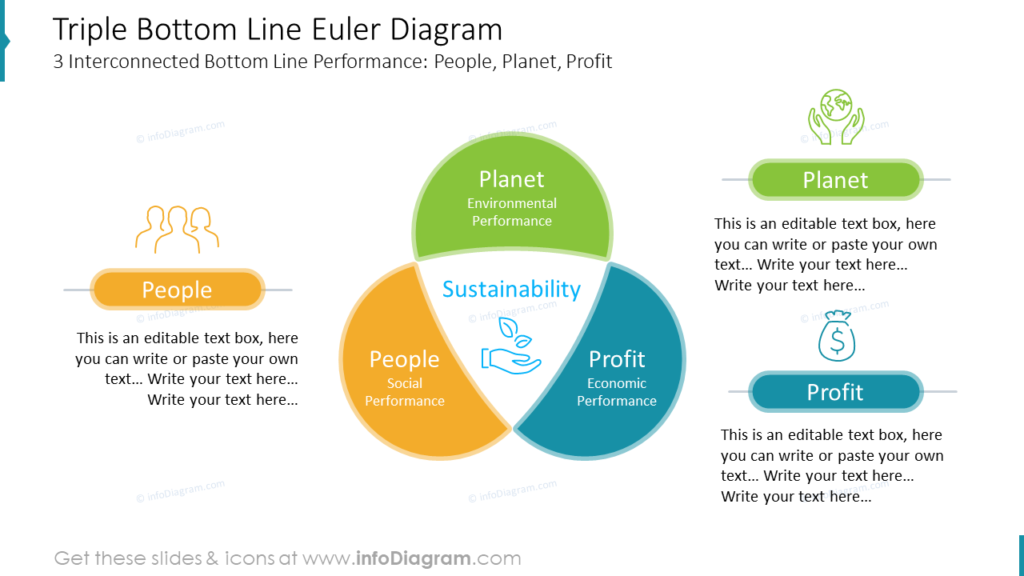
Another framework that includes sustainability in your growth strategy is the Triple Bottom Line concept, expanding traditional profit-only goals by impact on planet and people.
Practical Tips on How to Keep Your Audience Engaged While Talking About Business Growth
Whether you are presenting your growth strategy at a meeting or you are writing a business plan, make sure the presentation will engage your audience. Here are a few tips on how to do it:
Start with a clear message and purpose.
The key to creating a compelling presentation on business growth is to start with a clear message and purpose. This will help you stay focused and ensure that your audience understands the main takeaway of your presentation. Your message should be tailored to your specific audience and focused on the benefits of your business growth strategy.
Use data and visuals to support your points.
We can’t stress enough how important it is to back up your thoughts with data and visuals. This not only adds credibility to your presentation but also helps your audience better understand the information you’re presenting. Use graphs, charts, and other visual aids to illustrate key metrics and trends (check the graphics above for more inspiration).
Be sure to explain the data in a way that is easy to understand and relevant to your audience. Additionally, consider using case studies or success stories to demonstrate how your business has grown and succeeded.
Address potential objections and challenges.
When talking about business growth, it’s essential to anticipate potential objections or challenges that your audience may have. This could include concerns about competition, market saturation, or financial risks.
Address these concerns head-on and provide evidence to support your position. This not only shows that you have thought through potential challenges, but it also demonstrates your confidence in your business growth strategy. Also, be open to feedback and questions from your audience, as this can help you refine your presentation and address any lingering concerns.
Ensure design consistency and readability.
A well-designed and consistent presentation enhances the overall professionalism and credibility of the content. By maintaining a consistent color scheme, font selection, and layout throughout the slides, the audience can easily follow the narrative and focus on the message being conveyed.
Readability and reading flow play pivotal roles in effectively communicating information. By utilizing legible fonts, appropriate font sizes, and clear visuals, the presenter can ensure that the audience can effortlessly read and comprehend the content, leading to a more engaging and impactful presentation.
Further Inspiration
If you are looking for more business growth presentation design ideas, check the following blogs:
- How to showcase a business growth strategy plan
- Designing growth diagram in PowerPoint
- Using tree analogy to present growth
Get our free sample with example slides and stay tuned for more resources.


