Using Engaging Visualizations for Environmental Sustainability Presentation in PowerPoint
Do you need to present ESG strategy or report?
Let us inspire you on how to create engaging visualizations in PowerPoint with examples of environmental sustainability slides. Such Environmental Sustainability Policy report or presentation usually can include the following parts:
- defining the topic and ESG terms, in case you have people not aware of all concepts in your audience
- presenting the principles of Circular economy and other sustainability-related frameworks.
- illustrating areas influenced by ESG strategy
- presenting plans and steps of waste management
- visualizing the KPIs
Source of graphics presented here is available for download (link to visuals: Environmental Sustainability Policy ESG Report PPT Template).
Creating Term Definition Slide of Environmental Sustainability
If you have listeners not familiar with the sustainability terms you will present, it’s a good idea to explain those terms at the start of your presentation.
For example, explain what you mean by “Environmental Sustainability”, that it can be defined as the ability to maintain an ecological balance in our planet’s natural environment and conserve natural resources to support the well-being of current and future generations.
Good practice for slides with a definition is to illustrate it with a picture or an icon. Let’s have a look at what it can look like.
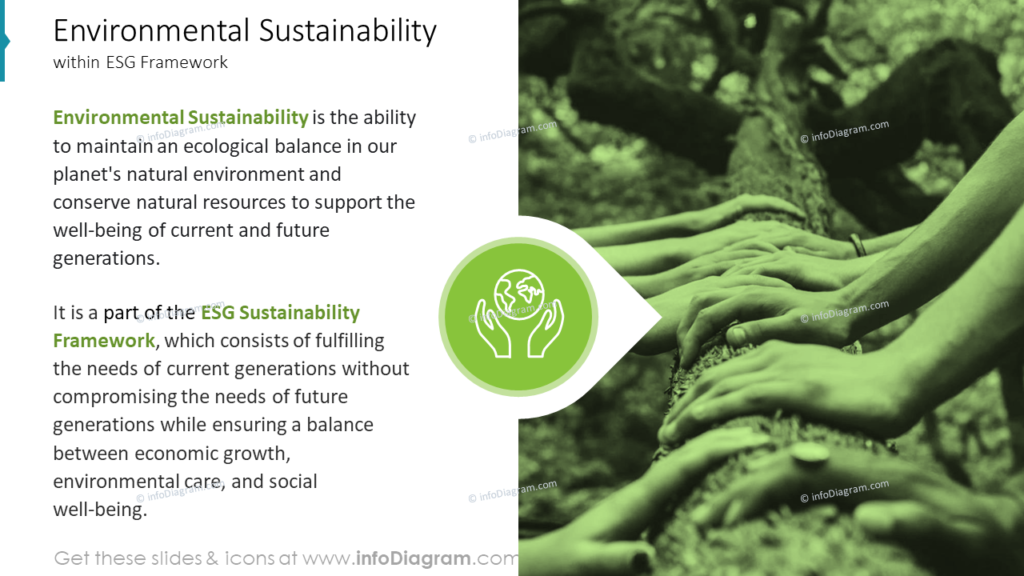
The slide is divided into two columns. The left side contains a description of environmental sustainability. The right side of the slide is fully covered with a picture corresponding to a topic. In the middle of both sections is placed an icon. This strategic fusion not only enhances the efficiency of the reading process but also contributes to improved memorability, offering an engaging and holistic experience for the audience.
Presenting the ESG Frameworks such as 7R
While you’re working with the environmental sustainability presentation, to may want to put it in the context of the 7Rs concept. This framework is commonly used in the context of waste management and sustainable practices. Each “R” stands for a different action or principle:
- redesign
- reduce
- reuse
- repair
- renovate
- recycle
- recover
To present this 7R principle of the circular economy visually on a slide, you can get inspired by the following slide design.
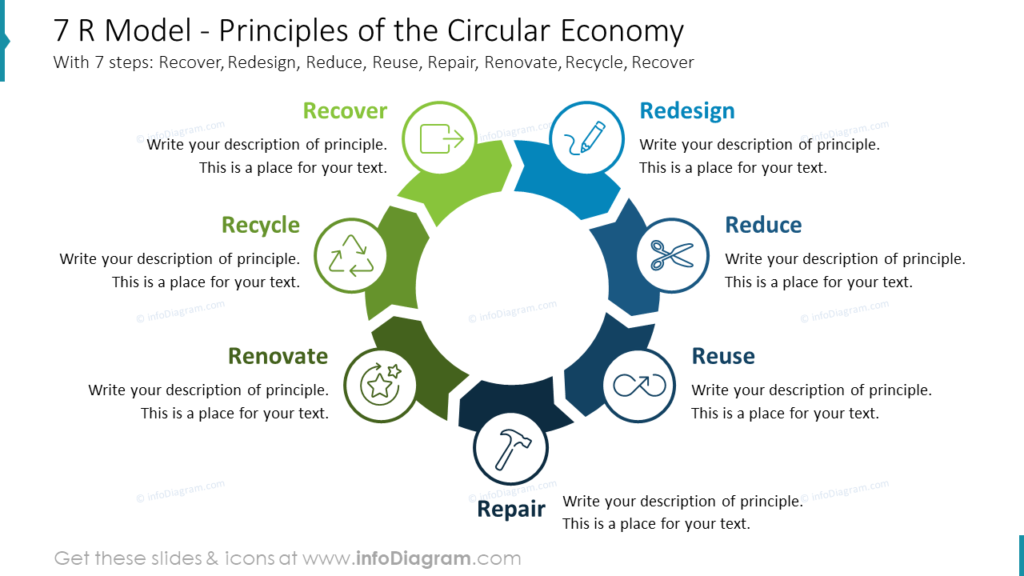
To visualize the circular process accurately, we created the circle diagram using arrow shapes. This approach is symbolic, reflecting the idea of a continuous cycle without clear beginnings or endings—an ongoing journey. To make the graphic more expressive we selected simple icons to represent each component (e.g. The hammer symbolizes the repairing action) and implemented them seamlessly on the diagram. Notably, the strategic use of icons aids memory retention by reinforcing the associated text.
It’s important also to keep the color consistency. By ensuring harmonious color usage, we prevent the slide from becoming visually overwhelming and facilitate a smoother visual experience for the audience.
Illustrating Supply Chain Areas for ESG Strategy
If you need to illustrate several areas influenced by ESG strategy, visual representation can be handy again. See our example of presenting four areas of a circular supply chain (demand, production, distribution, and packing). They focus on reducing the environmental footprint of the entire product lifecycle.
Incorporating these four areas into environmental sustainability presentation principles is a great way to position businesses to meet growing consumer demands for eco-friendly products and practices.
See how you can present such a topic using the full layout of the slide effectively.
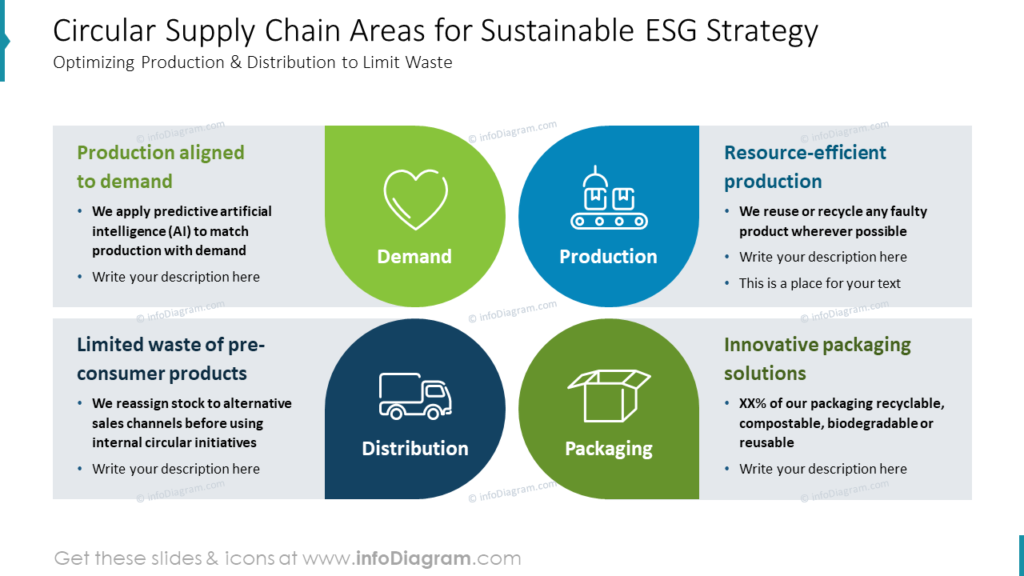
We like to maximize the usage area on a slide (of course while keeping safety and equal margins around), to achieve it, we filled the slide above with 4 big placeholders. Each of them has a dedicated place for a description and is visualized with a proper symbol. We decided to put the text on a grey background to emphasize the borders of each area. To make the slide visually appealing we recommend placing the icons on unique shapes. In the example above, it’s the shape of a drop. However, within PowerPoint, you will find many built-in attractive shapes.
Presenting Waste Management Plans
Another topic that can be presented in your environmental sustainability presentation is a waste management plan. The role of waste management in general is to minimize the negative impacts of waste on human health, the environment, and natural resources. A presentation for waste management can include several steps or elements, like the ones below:
- administration
- collection
- disposal
- segmentation
- recycling
Have a look at how those items can be presented on a slide using simple infographics.
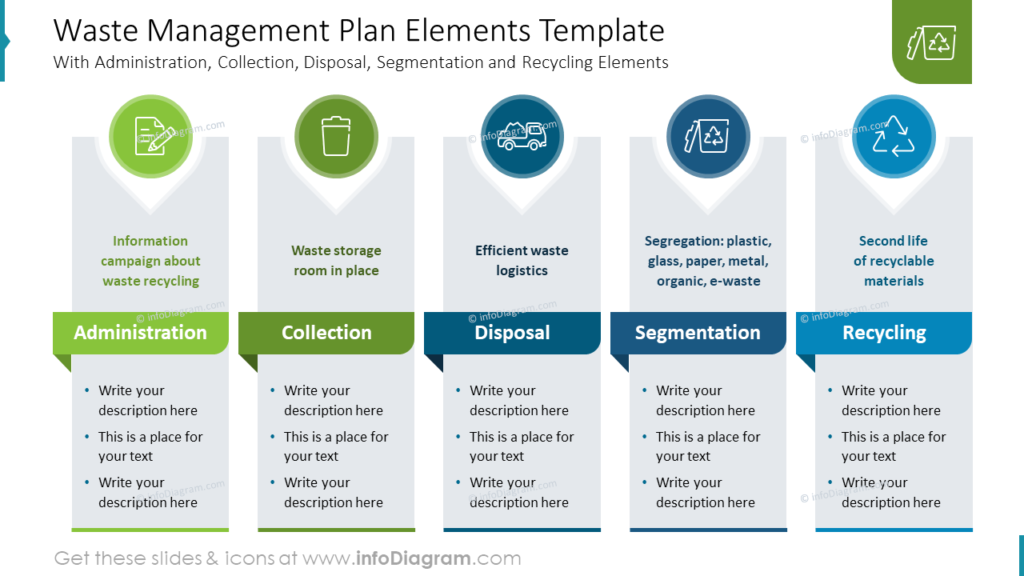
While we were designing that slide, the first thing we did was to plan the space for the text. In my case, it appeared to be quite much information so proper planning was the most important thing in the whole process. Opting for a calculated approach, we partitioned the slide into five distinct columns. This deliberate structure ensured that each element of the plan had a place for a title, subtitle, and description. To elevate the visual appeal and communicative impact of the slide, we enriched it with representative icons and creative shapes.
Incorporate the KPIs Creatively into the Environmental Sustainability Presentation
In the context of environmental sustainability, KPIs provide quantifiable data that gauge the effectiveness of sustainability efforts, track performance against goals, and inform decision-making.
Let’s have a look at the example below where we presented the transportation ESG initiatives KPIs and get inspired on how to incorporate them into your presentation.
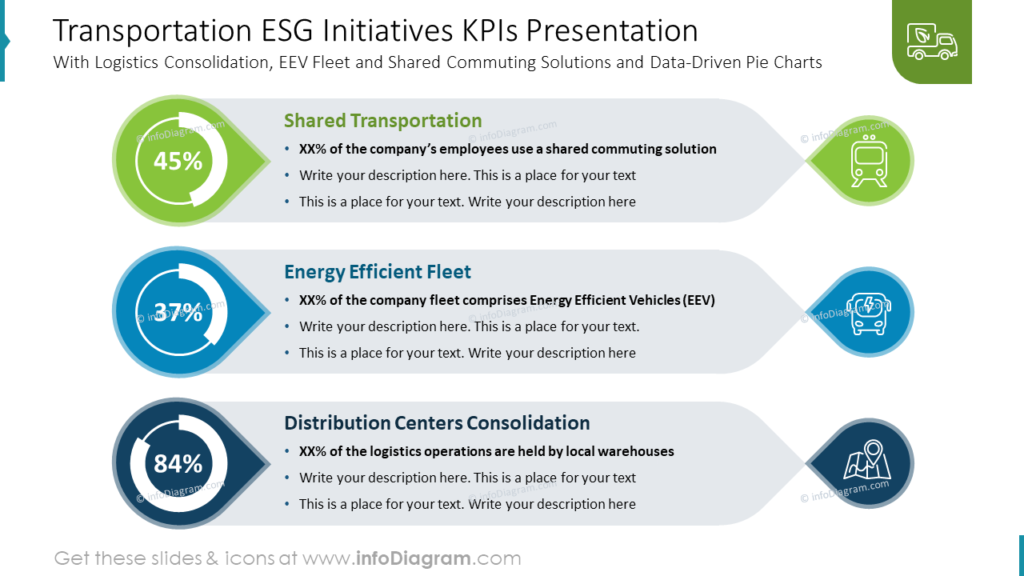
What’s worth remembering is that the graphical presentation of KPIs should have a place for statistics like numbers or percentages. This numerical data constitutes the core information to convey. In our slide design, We’ve allocated the most significant portion of space for this aspect (emphasizing its significance through the element’s size). Following this, the next critical element is the description, it should have enough space to describe the KPI thoroughly. Lastly, the KPI is visually represented using a suitable icon. While this part is less pivotal, it still provides a visual cue for quick recognition. As such, it’s designed to be the smallest element in comparison to the others.
Creating the Environmental Sustainability Presentation – Good Design Practices
Creating the slides for the environmental sustainability report in PowerPoint has several benefits that align with effective communication, visual appeal, and accessibility. I summarized the most important here:
- enhance the presented definition by incorporating a photograph to make it more attractive and easier to remember
- keep the color consistency throughout the whole presentation – choose a color palette that resonates with your theme and employ it consistently on each slide.
- use creative shapes to draw attention to the content
- before embarking on the design phase, and map out content space, especially for slides abundant in text. This ensures a balanced and engaging layout.
- employ a range of shape sizes to skillfully underscore and convey the significance of the information. Employ larger shapes to visually prioritize the most crucial data
I’m sure that with these basic design rules, you can make a stunning presentation and overall impression.
Resource: Environmental Sustainability Policy ESG Report (PPT Template)
The examples above used the graphics from a PowerPoint template on the topic of the Environmental Sustainability Report. All slides are available in the infoDiagram collection of presentation graphics.
If you are looking for more visuals to illustrate sustainability topics try our template for the circular economy and sustainability.
For more redesign ideas watch our video with slide redesign instruction:


