Best Practices for Designing Impactful Financial Reports that Resonate
Annual and financial reports help to explain your company’s performance, attract potential investors, and are often legally required.
Having an insight into the company’s situation is important to various stakeholders – executive board, management, investors, partners, and employees. Therefore, it is worth creating informative but at the same time memorable reports that are easy to read and understand.
At the end of the year businesses evaluate their results and goals’ achievements of the past 12 months and sets expectations for the new period.
Reports full of data and analysis are typically difficult to digest by non-financial audiences. Any manager, who prepares an annual or financial report knows the pain. It might be challenging, time-consuming, and stressful. But maybe there is a way to make the process easier? If you want to disclose your annual numbers simply and understandably to your key stakeholders, use structured PPT templates that will help you present your data in an eye-catching and attractive format.
During my corporate life, I used to present results and achievements to the executives at board meetings or to employees at town hall gatherings. Each time, I tailored my messages to resonate with them. I always took 2 elements into consideration – content and format. Let me give you some hints from my experience, which can help you create the perfect report.
Content – organize information in your financial reports effectively
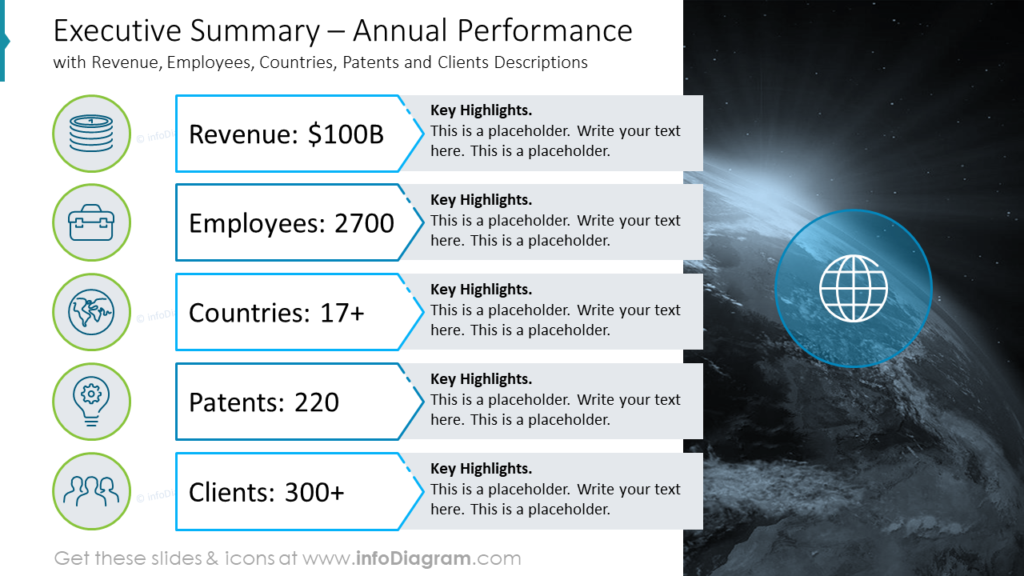
Executive summary
Provide a brief overview to summarize the main findings, conclusions, and recommendations. It is the first thing your readers will see, and it may be the only thing they read. Therefore, it is important to write an executive summary that captures the essence and value of your report. It should be concise, clear, compelling, and powerful.
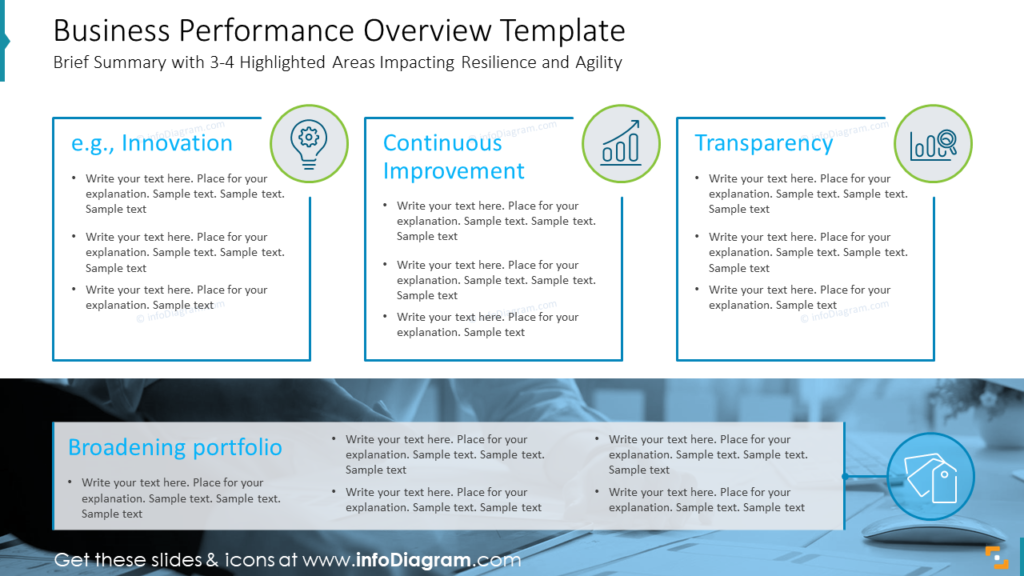
Business performance section
Integrate non-financial information, such as market conditions and operational challenges, to comprehensively view the business environment. Outline the status of your company in brief, provide key business snapshots, address major accomplishments, summarize milestones and, if possible, address ESG issues.
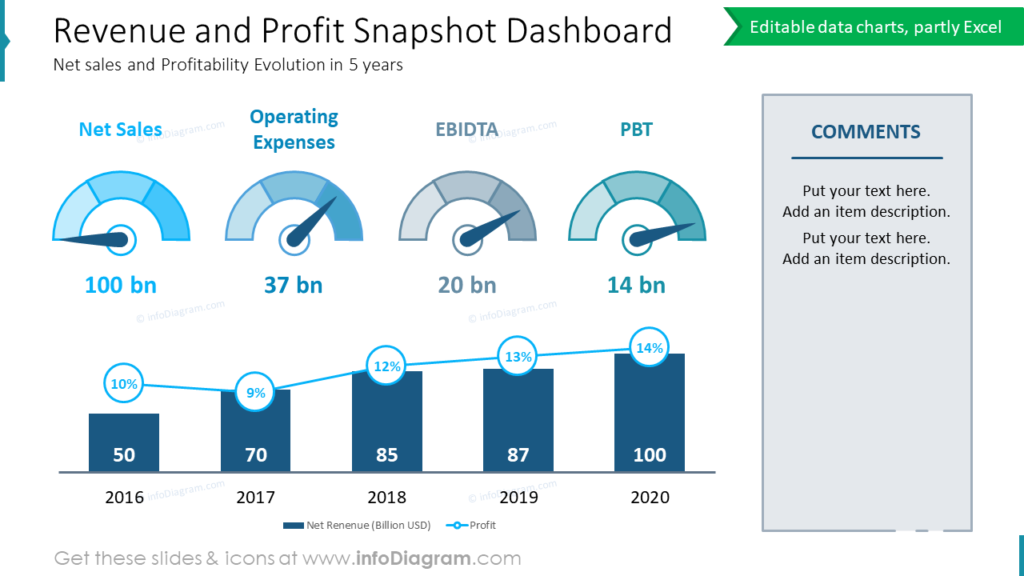
Financial overview section
Present your income statement, balance sheet, cash flow statement, and relevant financial metrics and KPIs. Go beyond raw numbers by offering insightful analysis and explanations, helping your audience to understand the meaning and implications of financial data. Provide historical context to highlight trends and changes over time, aiding in a deeper understanding of financial performance.
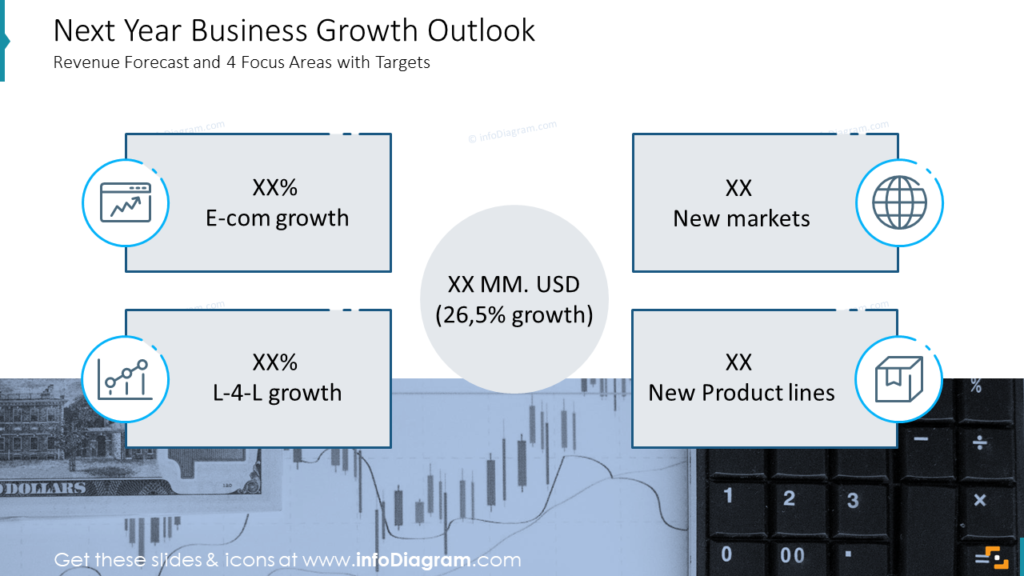
Business outlook
Offer forecasts and future-oriented analysis to guide stakeholders on potential financial developments. Describe the expectations and focus areas with corresponding targets, strategies, and tactics.
Format – convey your information simply and engagingly!
Well-organized structure: a well-designed report is easier to read and follow. It has a clear order, a consistent format, and a logical flow. It uses headings, subheadings, bullet points, and white space to break up the text and highlight the key points. Have your audience in mind and guide them smoothly through your report.
Visuals and data: a comprehensive report contains charts, graphs, tables, dashboards, and images to present data and information visually. They allow you to provide additional information that is not possible with text alone. Visuals can help the audience grasp the main trends, patterns, and insights. Make sure that you label them clearly, and explain them in the text. Visuals are critical to the understanding of the data, but adding text with explanations and further details is equally important. Finding the balance between the two will create easy-to-read and more comfortable-to-understand reports.
Storytelling: you can use storytelling to turn your financial data and analysis into a compelling story that showcases your achievements, challenges, opportunities, and vision. Use anecdotes, testimonials, quotes, or case studies to illustrate your points. You can also use a hook, a climax, and a call to action to create interest and action.
Simplicity: overcomplicating your financial report can make it difficult to understand. Use simple language, avoid jargon, and focus on the most important data. No one wants to read an exhaustive list of all your accomplishments, focus on key points to convey the message.
Some of us, including myself, have participated in boring and unstructured presentations during which the speaker bombarded us with huge amounts of data on endless slides. Let’s try to make our annual or financial reports comprehensive and memorable. Remember about the content and format. An additional element of a successful presentation is thorough preparation and ensuring that you craft your message toward your audience and its needs.
Good luck with creating engaging annual and financial reports!
Related Resources
If you’re looking for more inspiration and examples of illustrated report-related presentations, have a look at the following resources:
- Selection of Year-end report PPT templates
- How to draw attention to the main message
- Design examples of presenting annual budget proposals in PowerPoint
- PowerPoint slide examples for informative & powerful financial presentations
- Consistency hints to avoid messy slide look
- 10 slide ideas for financial report presentation
- How to prepare an impactful ESG sustainability report
Author: Katarzyna Podlejska, Independent Business Consultant