Visualizing POS Segmentation Using PowerPoint Graphics
Do you need to present a segmentation of some kind? For example a retail POS strategy or another one? Get inspired on how to visually convey segmentation models using PowerPoint. If you want to transform data into a more visual one and engage audiences, you can elevate the visual impact of your presentation. In this article, we showcase slide ideas for illustrating POS segmentation using diagrams and table design.
Get all the graphics presented here – click on the slide pictures to see and download the source illustration. Check the full Point of Sale Segmentation Strategy PPT Template.
Creating a Slide for Clear POS Segmentation Definitions
Point of Sales segmentation is the process of grouping them with shared characteristics into clusters. This enables optimization of POS level activity, including ranging, pricing, merchandising, and promotions suitable for that particular segment. Clustering/grading prevents retailers or brands from applying a one-size-fits-all approach that can result in POS underperforming.
Your audience may not be acquainted with the terms related to POS Segmentation that you’ll be covering, so consider providing explanations at the beginning of your presentation. This will ensure that your audience understands this term as much as you do.
One of the ways to present the definition is to use a picture or an icon illustrating the subject. That helps make something clear.
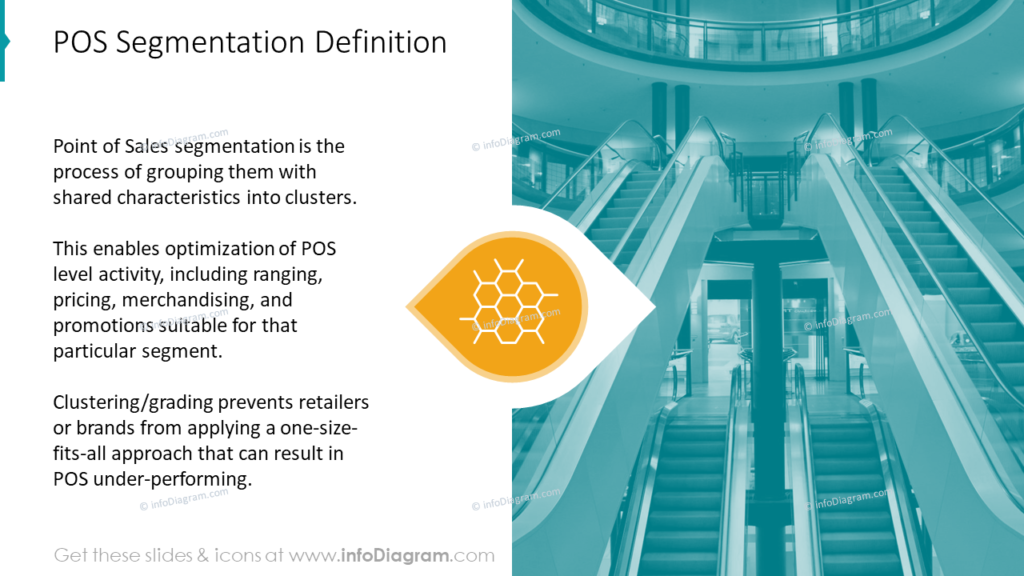
When designing this slide we decided to use the layout that consists of two sections. The left side contains the definition of Point of Sales segmentation. We filled the right side with an image relevant to the topic. This layout helps in easy reading and additionally enriches the content. Moreover, in the middle, we added the shapes with the icon of honeycomb hexagon segments for a better visual illustration of the segmentation topic.
Presenting the 4 Store Characteristics Components
In the next slide, you can introduce the segmentation criteria visualized as a quadrant matrix. Such a matrix framework can be used to organize for example retail POS subjects in 4 store characteristics components:
- POS location
- type
- shop size
- annual sales
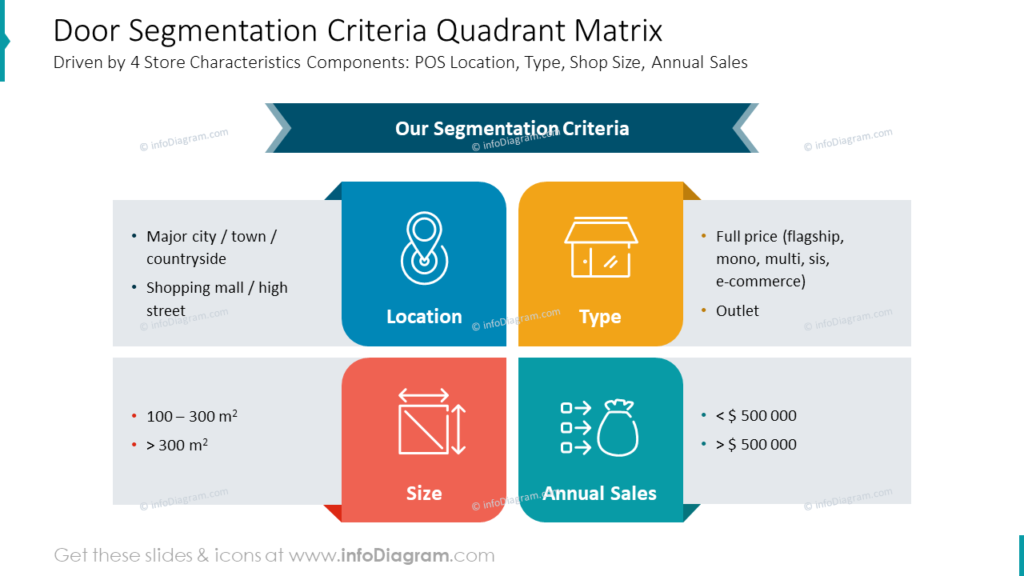
To present such four segments on a slide in a visual form, we suggest using the power of a quadrant visualization. Each quadrant uniquely highlights a key component, offering a visual breakdown of the segmentation criteria. To make the graphics more expressive we used harmonious color coding, thanks to that we prevented the slide from becoming visually overwhelming and facilitated a smoother visual experience for the audience.
We also used representative icons for each item, for more intuitive readability, e.g. you can see a marker icon of the map, you know it’s about the location, etc. For that, the slide can be more friendly for your audience.
Compare Strategies Relevant to POS Segmentation Cluster
If you’re seeking slide concepts to explain and compare the POS segmentation strategies, we suggest the use of a custom design comparison table. This versatile table can encompass various elements such as:
- Overall strategy
- Product strategy
- Marketing strategy
- Operational strategy
- Customer service
This approach allows for a comprehensive and organized presentation of the key components within the POS segmentation strategy.
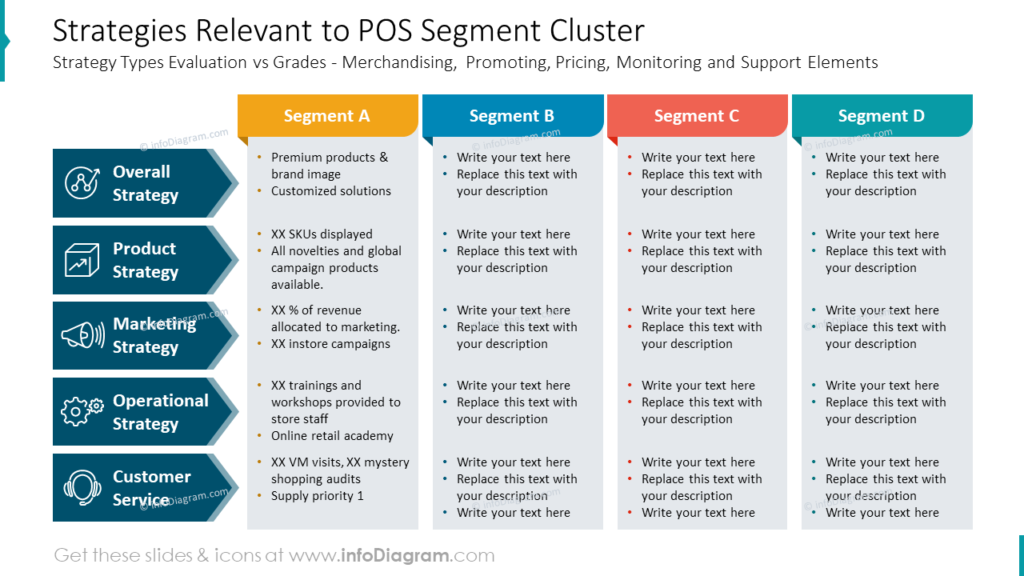
Our slide design proposal contains a table with POS segment clusters and strategies relevant to them visualized as arrow shapes. Moreover, we added suitable icons into specific strategies to enhance recognition and visual appeal. The composition of the slide is still clear and easy to read.
As you can see, here are a lot of texts. We maximize the usage area on a slide but remember about keeping safety and equal margins around.
Illustrating 3-Dimensional Segmentation Cube
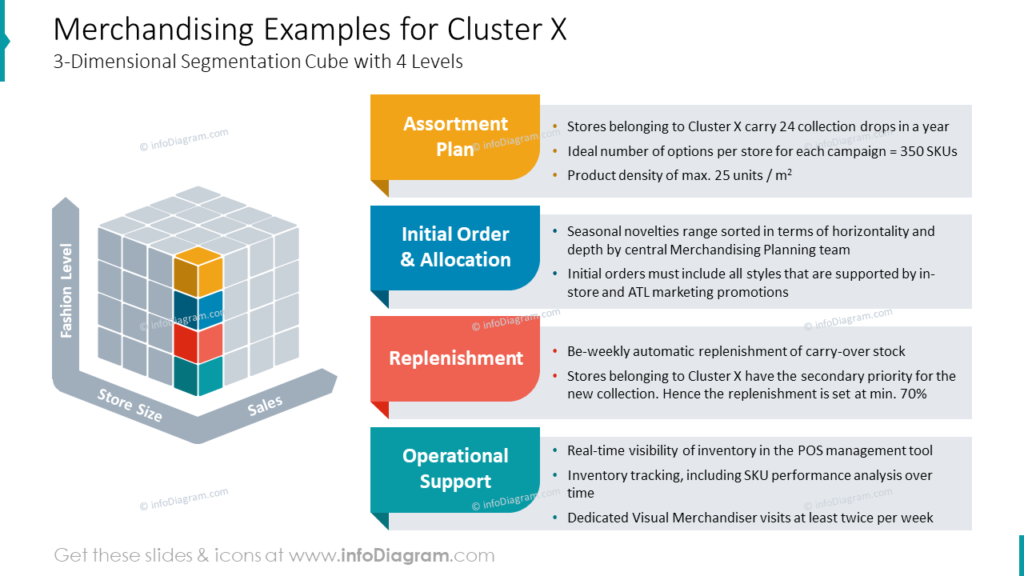
To illustrate market segmentation for a cluster, you can consider using a 3-dimensional segmentation cube.
In this case, we used three segmentation categories:
- fashion level,
- store size,
- sales.
Then we presented various points in this 3d matrix with four merchandising examples:
- assortment plan – strategically plan product offerings to meet customer needs and market trends,
- initial order and allocation – efficiently managing the first orders and distribution of products to optimize inventory.
- replenishment – implementation of timely restocking strategies to maintain optimal inventory levels and meet demand,
- operational support – providing the necessary operational assistance to ensure smooth processes and effective execution.
For similar segmentation content consider using e 3D cube visualizations, as we suggested above. This not only adds a visually appealing element to your presentation but also enhances the audience’s understanding of the segmentation topic.
Presenting Cluster-based Marketing Strategy
When you want to present a Cluster-based Marketing Strategy you can show it as a comparison of various clusters next to each other.
See the slide design we proposed for such a comparison.
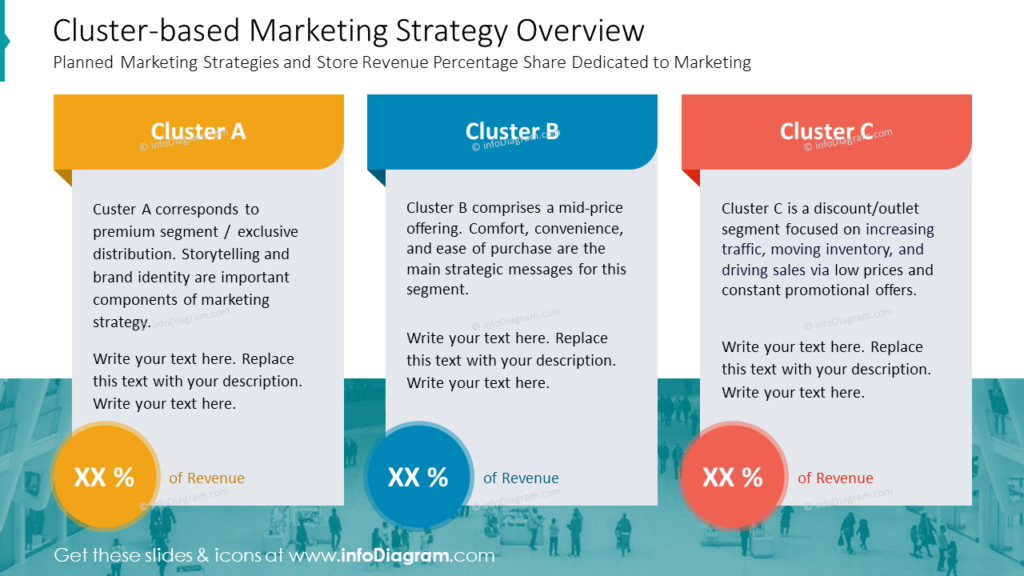
During the design of this slide, our initial step was the layout to allocate space for the text. Here we have 3 clusters, so we decided to make 3 columns refer to them. That’s an easy way to do visual composition, where we have more text to show.
In the next step, we showcased the revenue of each cluster by round shapes. The revenue is featured as an important factor for marketing strategy, so if you have data you want to highlight, you can use simple shapes with outlines to elevate the communicative impact of the slide.
Additionally, at the bottom of the slide, you can see a picture that refers to the topic. You can use a background like that to enhance visual appeal, reinforce the theme, and captivate your audience’s attention.
What to Remember about Visual Presenting of a POS Segmentation Strategy
If you are working on a similar presentation of market segments, remember a few simple design rules for a clear, eye-catching, and easy-to-understand presentation:
- pick one graphical style that aligns with your theme and apply it consistently,
- use creative shapes and graphical elements to highlight key content and draw attention,
- plan out content space, especially for text-heavy slides, ensuring a well-balanced and captivating layout. Don’t stuff too much into one slide, you risk it will be unreadable and your audience will get lost
- add a photo or illustrative icons, making the slide memorable and visually appealing.
I’m sure that with these basic design rules, you can make a stunning presentation and overall impression.
Resource: POS Segmentation Strategy Presentation PowerPoint Template
The examples above used the graphics from a PowerPoint template on the topic of POS Segmentation Strategy. All slides are available in the infoDiagram collection of presentation graphics:
Moreover, you can extend your presentation with business growth strategy visuals.
Subscribe to the newsletter and follow our YouTube channel to get more design tips and slide inspiration.


