How to Present Machine Learning Algorithms in PowerPoint
Are you looking for ways to present Machine Learning Algorithms? Mathematical models used in AI technology are based on complex computational techniques that are not always easy to explain.
Therefore, we recommend presenting those AI concepts using certain abstractions and visual illustrations in diagrammatic form. Diagrams are great data visualization forms to express computational processes and data structures used in Machine Learning.
Let me present several examples of such AI diagrams.
Source of graphics presented in this article is available in infoDiagram slide library. Click on the slide pictures to explore and get the source illustration. See the full set of AI Algorithms, Neural Networks Diagrams and Machine Learning concepts here.
Start with Presenting a Bigger Picture of the Machine Learning Process
If you want to give a big picture of how AI models are created, present all steps, including how they relate to the business context.
Have a look at how we illustrated such a process. We chose a waterfall diagram that starts with understanding a business challenge and finishes with deploying an AI model in an operational environment.
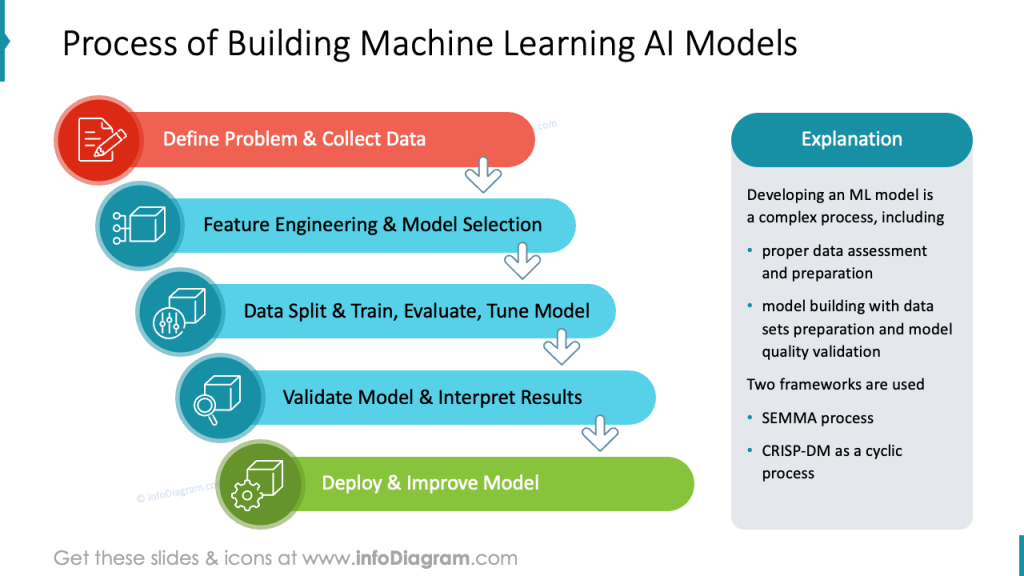
Notice the selection of icons to represent a specific model-building action. The AI model is a generic box with actions with specific attribute symbols – tuning, validation, and deployment.
Here’s another version of a similar process of predictive model development.
Unlike the example above, the flowchart below expresses the iteration loop of ongoing model monitoring and update.
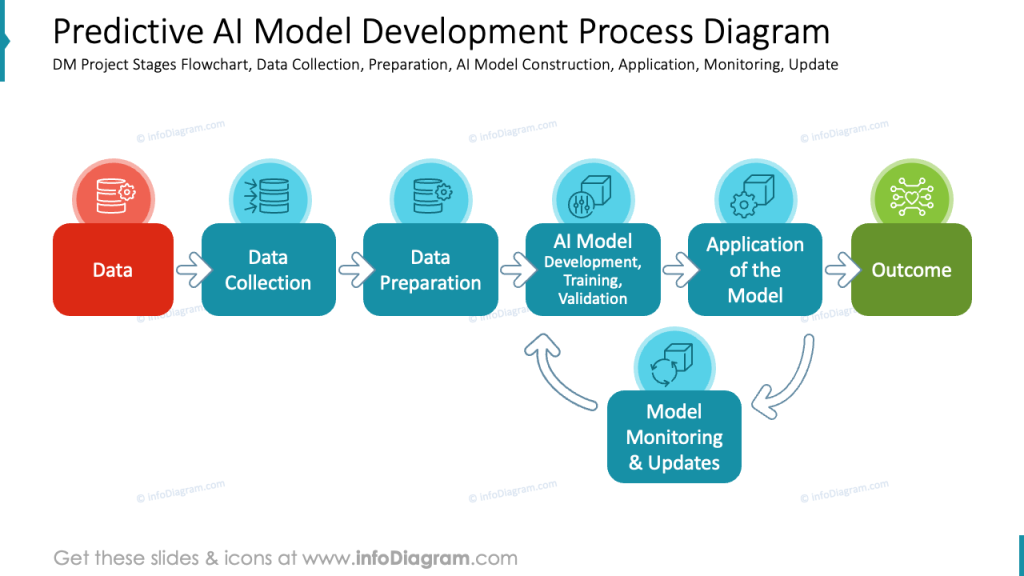
See how the entry and exit blocks have different colors to underline the touch points between AI technology and the business environment.
Illustrating CRISP-DM Framework for AI Model Building
Machine learning technology has been with us already for a while, not only in the academic area. It was just less publicly known, but IT companies have been developing trends forecasting or credit scoring models for banks already for decades.
There are already established industry frameworks for constructing AI models, such as SEMMA Framework or CRISP-DM.
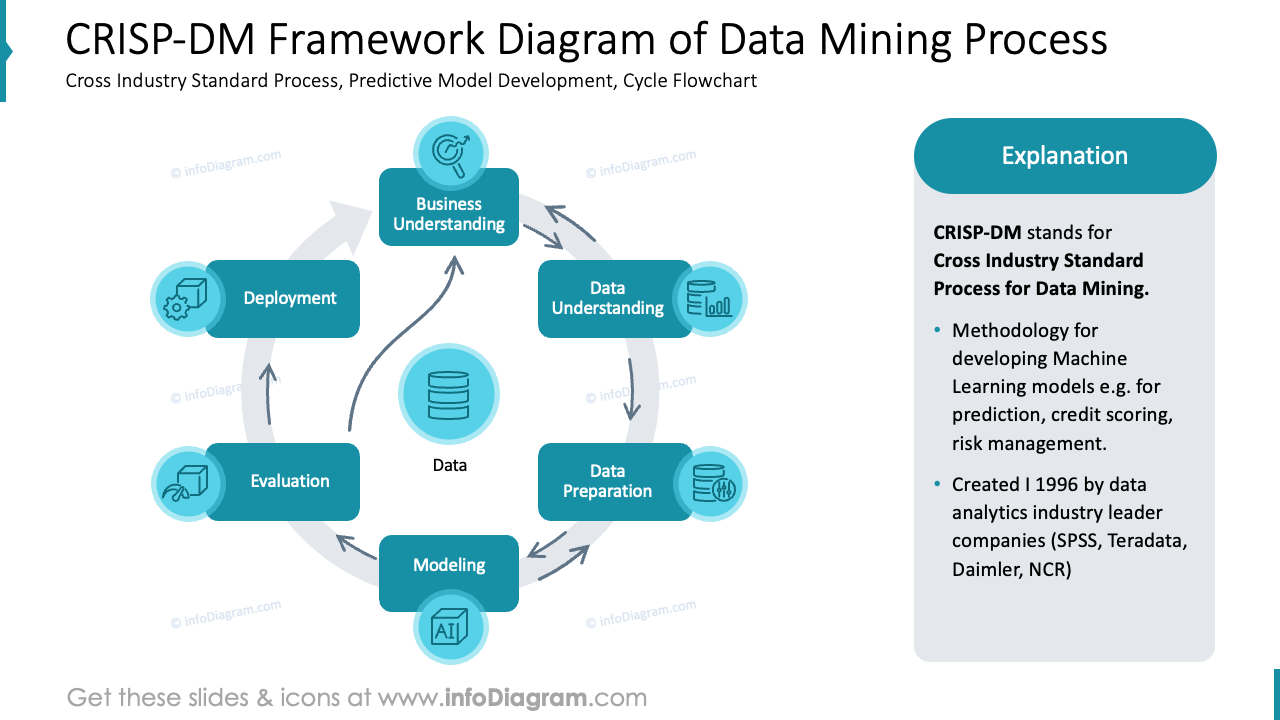
CRISP stands for Cross Industry Standard Process for Data Mining and was created in 1996 by several IT companies. At that time, Data Mining was the name used back then for what we call today rather than Data Science, or more broadly, AI technology.
CRISP-DM is presented as a circular process composed of
- Business understanding phase – defining the problem to be solved and understanding the business context
- Data understanding phase – set of data collection, exploration, and analysis activities, to get insights into data characteristics
- Data preparation phase – further work with data to prepare it for the data modeling phase. Includes data cleaning, transformation, and integration
- Modeling phase – application of Machine Learning Algorithms to develop an AI model
- Evaluation phase – assessment of model quality to determine model performance
- Deployment phase – applying the best model to a production environment and start solving the business problem in daily operations
The best way to express such repeating phases framework is by some kind of loop flowchart.
See the below example of how we illustrated the CRISP-DM model with a circular flow diagram. The big wide arrow expresses the iterative nature of the process, and the small arrow shows a more exact flow between particular elements. You can see, for example, that after model evaluation, there is a fork in the process – either the model is good enough to go to the deployment phase, or if the model quality is bad, there can be a need to repeat the whole process, from the first point of business understanding.
Presenting the Types of Machine Learning Algorithms
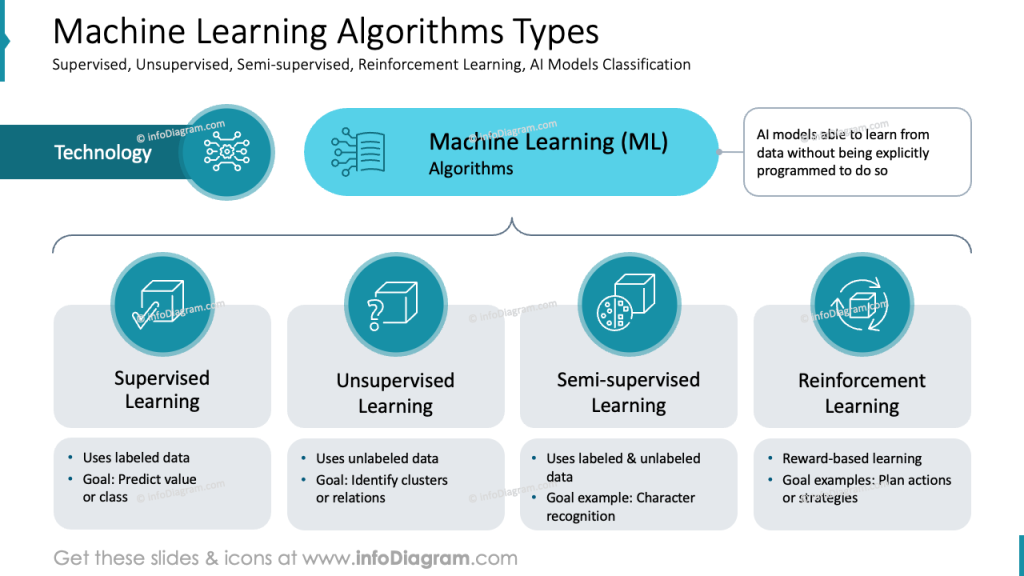
If you want to explain what types of Machine Learning Algorithms there are, instead of just listing the groups, you can present them as a structure diagram.
Let’s assume you want to present four main ML algorithm types:
- Supervised learning algorithms
- Unsupervised learning algorithms
- Semi-supervised learning algorithms
- Reinforcement learning algorithms
It’s better to preset each group as a separate object on a slide. That allows you to reorganize the layout, for example, from a horizontal listing to a vertical one.
Then, you can drill down to present particular ML groups with their tasks and algorithms, such as
- Classification task by Naive Bayer, Logistic Regression, SVM, or Artificial Neural Networks
- Regression task by Linear Regression or Random Forrest algorithm
- Data clustering task by K-means, HMM, or Gaussian Mixture models
- Dimension reduction by DBSCAN or PCA algorithms
Here’s the way how you can present the organization of those tasks and methods in a structured diagram:
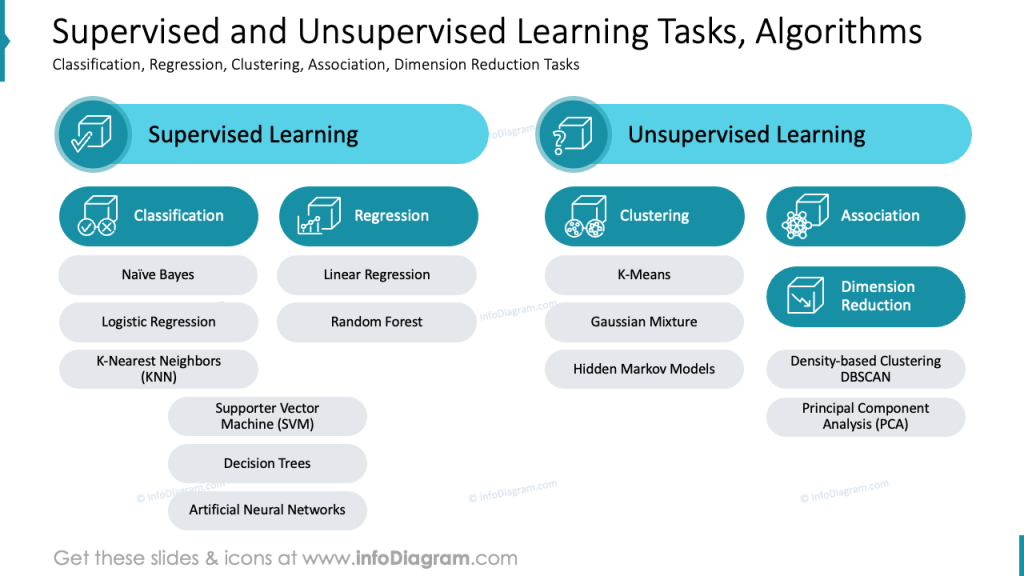
Notice how you can create one consistent flow by using the same graphical style (here rounded shapes) and the same icons assigned to the categories of Supervised and Unsupervised learning. This helps the reader to keep track of the presentation structure.
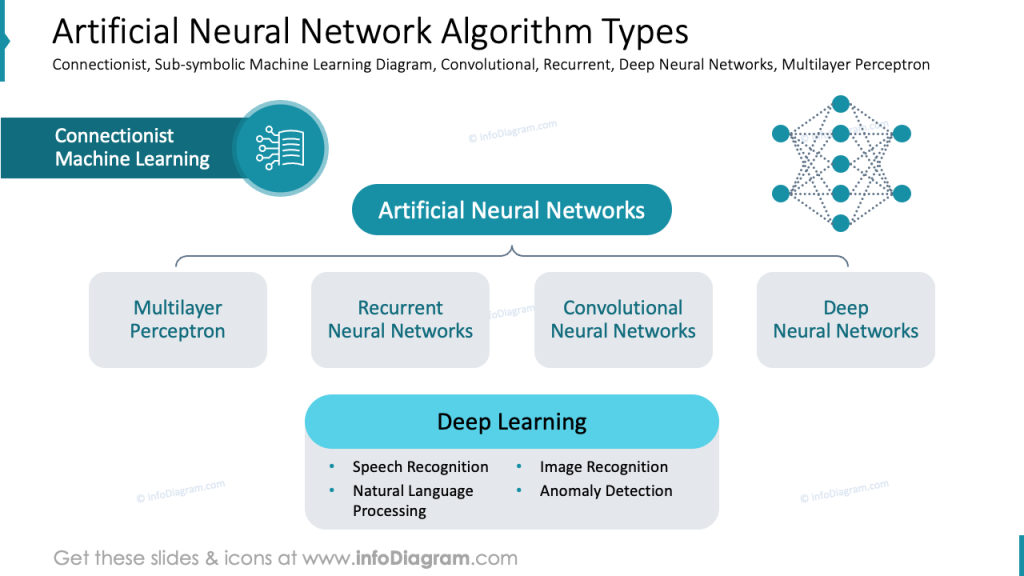
Showing Groups of Artificial Neural Network Types
For presenting sub-types of ANN algorithms, you can follow a similar way as we illustrated above when showing types of Machine Learning Algorithms.
Here, we added an illustration of Neural Network (created in PowerPoint from dots and arrows) and the same style of header and text boxes.
Creating an Illustration of a Decision Tree ML Algorithm
To illustrate how a decision tree algorithm works, draw a simple tree structure that represents a classification process.
You can do that using only standard PowerPoint shapes using shapes and connector lines. We presented various node types by different shape colors, and we illustrated the specific data instance classification path with a thicker full-line arrow.
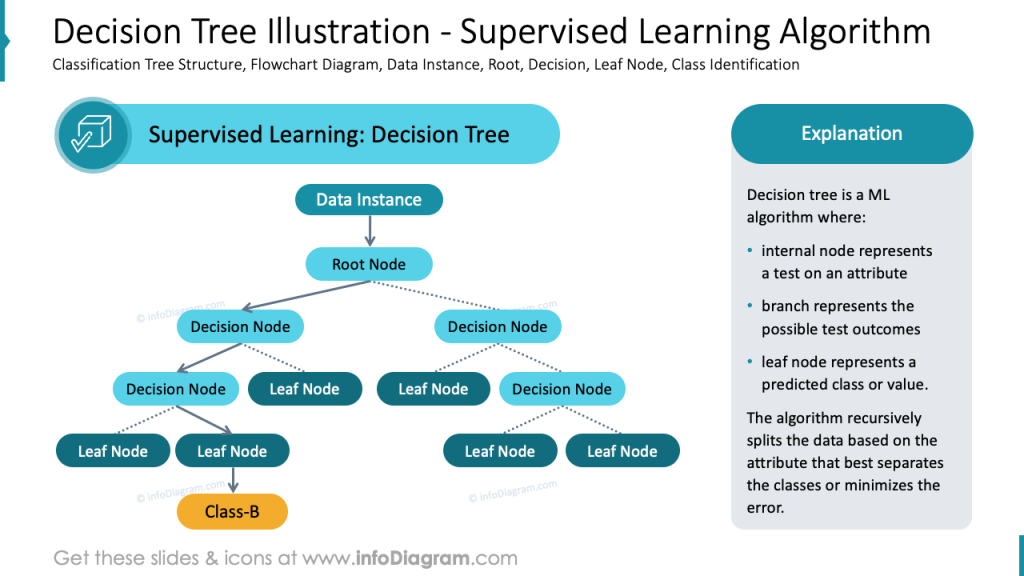
Diagram design tip: When you draw such a tree, make sure shapes are aligned horizontally and sub-nodes are centrally aligned to their parent node. It’s good if the node shapes have the same size or at least the height. This will create a balanced illustration of a decision tree and its levels.
Presenting Mathematical Formula Used in Naive Bayes Algorithm.
To present a mathematical formula in a readable way, it’s better to explain the variable right next to the formula, not in a separate legend window, as is usually done.
Here, we have an example of a statistical formula used in the Naive Bayes classification algorithm.
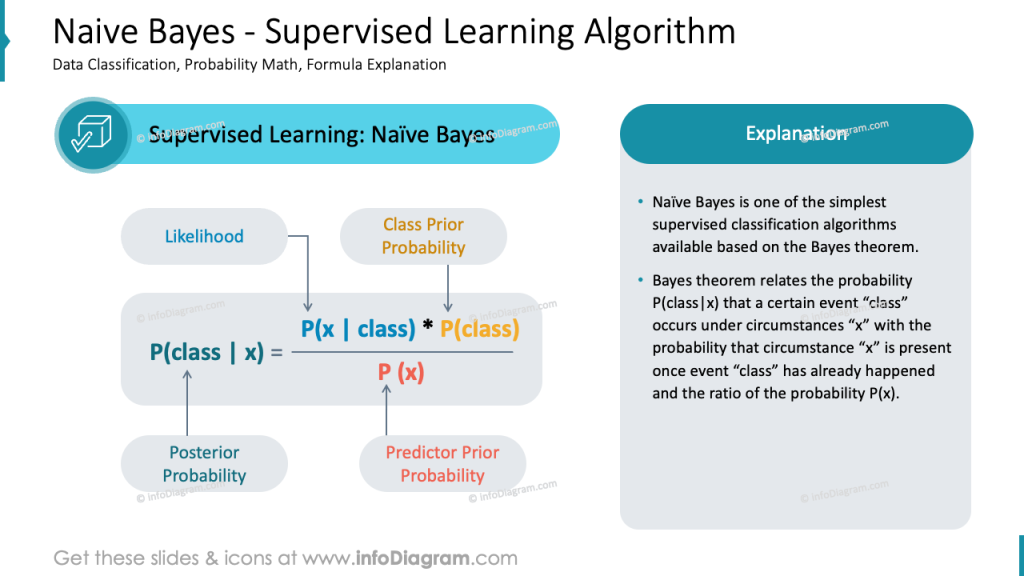
See on the slide above how you can visually explain the elements of such a math equation. Create call-outs next to the formula. We used arrows to point to the variable and light grey text boxes to add variable names and eventual explanations. Consider also using color coding to distinguish particular variables.
This is a rather simple formula to illustrate, as there are only 3 variables in the equation. But you can use the same design tips also for presenting more complex formulas.
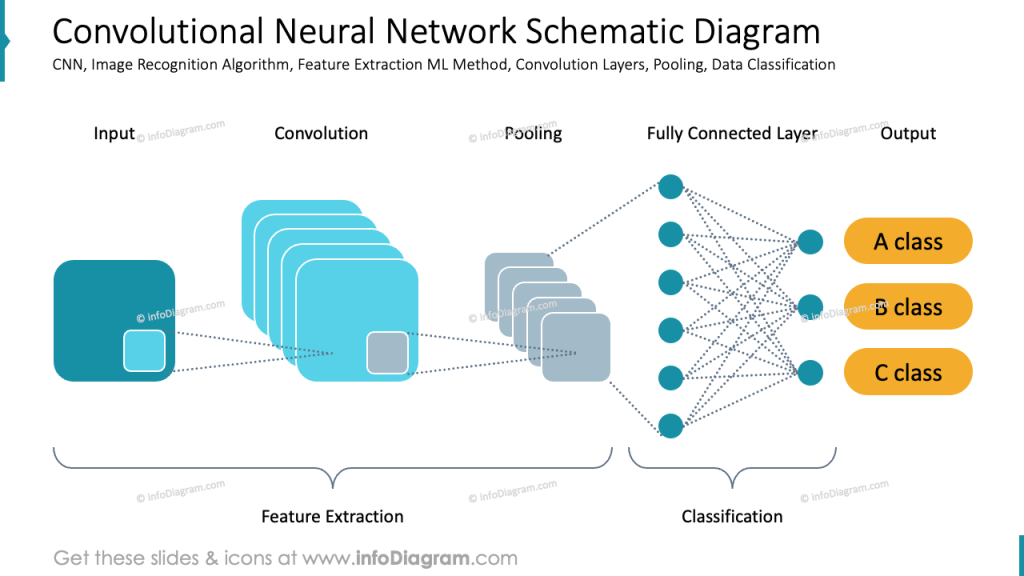
Visualizing CNN algorithm by flowchart diagram
To explain a process of machine learning process, I recommend to use a block diagrams. They can clearly show stages of the process and data flow from input, through data preprocessing, feature extraction to final classification.
Here is an example of illustrating how Convolutional Neural Network (CNN) algorithm works. This is more sophisticated Machine Learning method used for image recognition, where we have a feature extraction block, that does initial recognition of various traits in the picture e.g. identifying specific shapes.
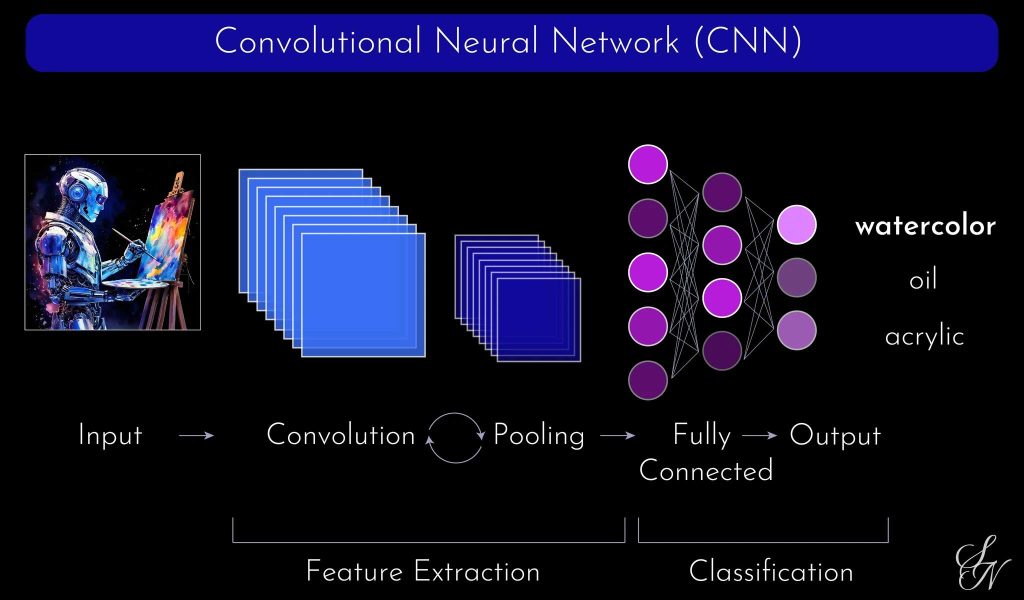
Here is another illustration of the same process – an interesting example of image painting style classification – whether it is watercolor, oil or acrylic art. This is an example picture from Data Immersion blog by Sylwia Nowakowska that studies the use of AI for data art & data visualization.
Illustrating Confusion Matrix – Merging Excel Tables and Design
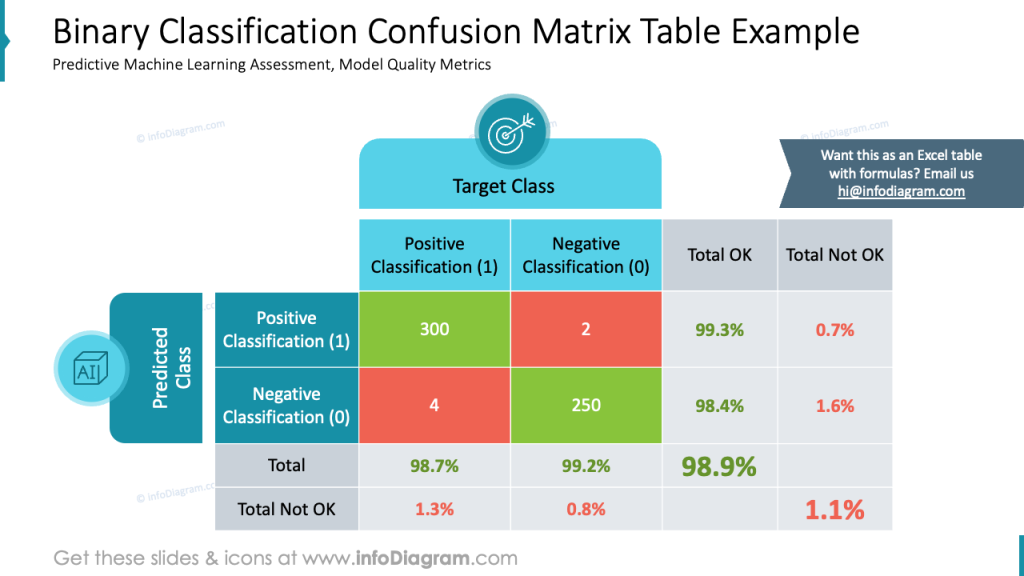
One of the common ways to assess a predictive model’s quality is a confusion matrix.
To present the confusion matrix on a slide, you will probably want to copy there a data table with calculated values.
To present Machine Learning Algorithms in a more visually attractive way like this, do this instead of presenting a raw matrix table:
- adjust table cell colors to express positive and negative classification
- align table values, to be in the cell’s center or align right.
- ensure there is enough margin so the numbers are not too close to the cell border for better readability
- you can add a custom design to illustrate column and row headers and add a graphical symbol to distinguish target and predicted class.
Here is an example of such a slide for binary classification:
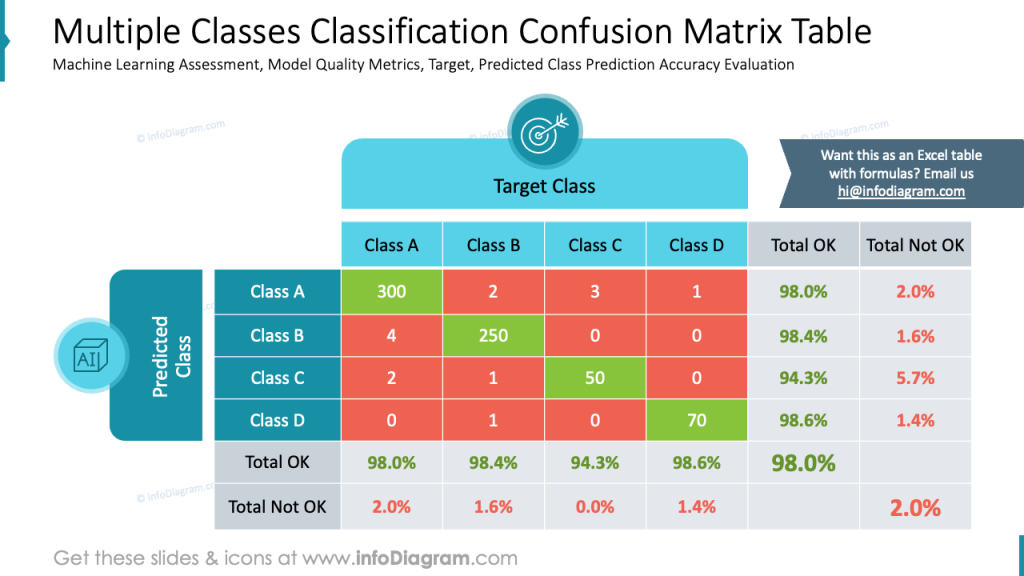
Here’s an example of a confusion matrix table for multiple class classification.
Final Design Hints for Presenting Machine Learning Algorithms Visually
To present Machine Learning Algorithms in an eye-catching way, apply visual aids such as flowcharts or structure diagrams to illustrate complex concepts.
To make those illustrations look professional, apply the slide design rules:
- Try to express information by diagram rather than by block of text, wherever you can.
- Use one graphical style over the presentation – a limited set of colors, the same shape style, and stick to one or two fonts.
- Prefer simple clarity over decorations. As you can see, you can do a lot even when using only standard PowerPoint shapes.
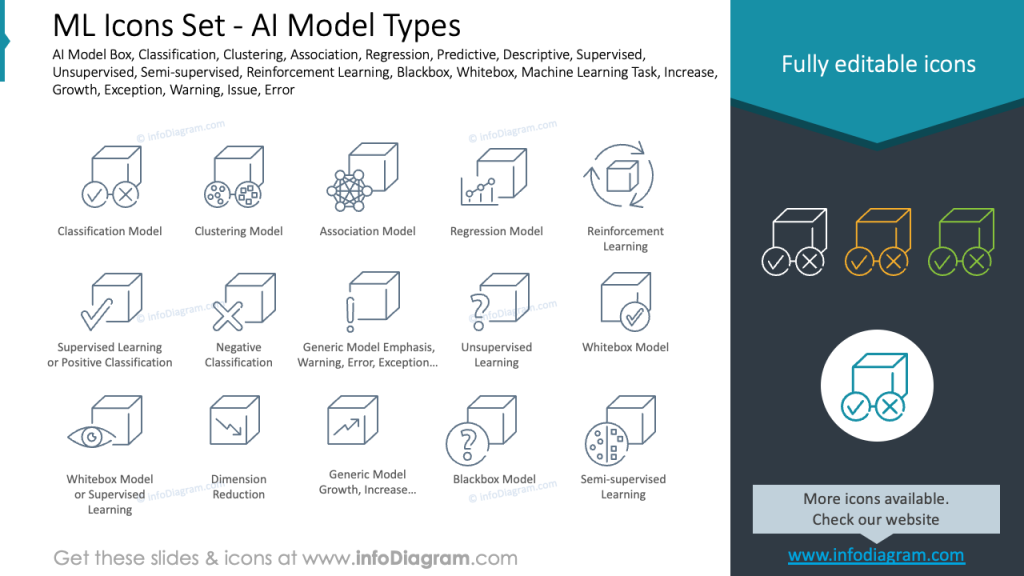
- Consider adding icons to represent key concepts – they are a minimalistic way to decorate slides without adding information noise. See our AI icons examples on pictures below:
Resource: Visual Aids to Present Machine Learning Algorithms
If you want to save time creating a presentation about such AI models, use the slides from the examples above. The full presentation is available as an editable PowerPoint file in the infoDiagram collection:
Check other blog articles with more slide visualization examples: