Make Effective Fiscal Presentations with Finance Data Charts in PowerPoint
Are you making a financial review for your company or organization? Presenting financial…
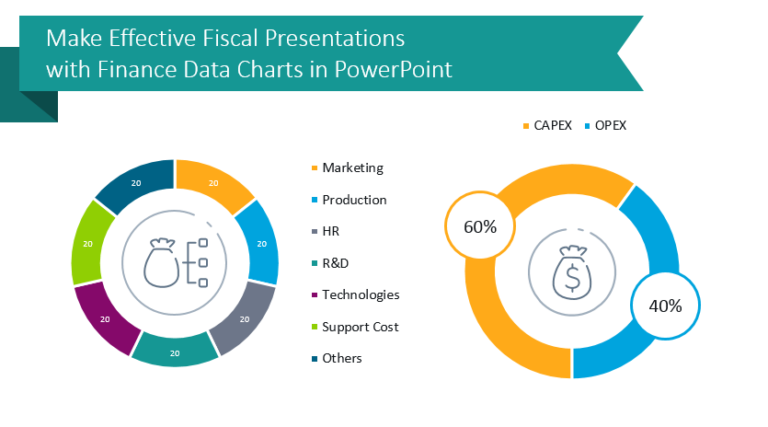
Ideas for illustrating data in PowerPoint. See how data charts can be enriched graphically so they look more attractive and professional, while data is still editable.
Some blogs contain templates with real data (like macroeconomic values e.g. country GDP, population, or unemployment rates – based on recognized data sources). Or we added exemplary data.

Are you making a financial review for your company or organization? Presenting financial…

Do you need to present web analytics? Whether you’re explaining a website analytics…