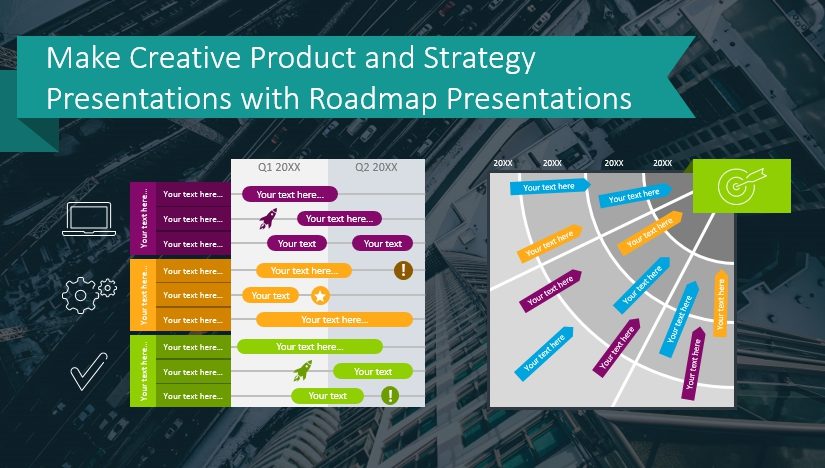
Roadmap tables graphic are a representation of the timeline for product development or company strategies. These strategies might be planned for months or years in the future. They are marked with project milestones or company objectives. You can also highlight the duration of tasks or the deadlines for achieving certain deadlines.
Continue reading Make Creative Product and Strategy Presentations with Roadmap TablesPresent Processes Creatively with Flow Chart Diagrams
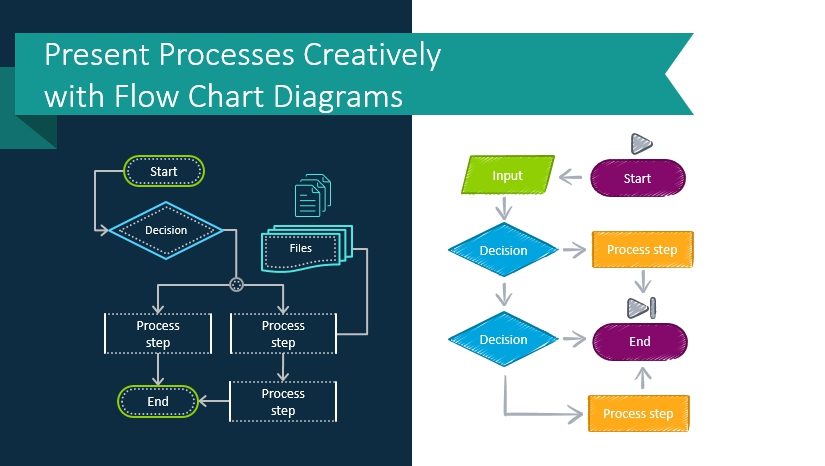
Presenting processes and algorithms is tough. Getting your audience to understand your message and be interested in what you have to say is only part of the struggle. By utilizing creative icons and graphics you can take some of the pressure off. By adding editable flow chart diagrams you can explain how particular informatics algorithms work, how decision processes should function, visualize your ordering process, show the journey of your website visitors, or highlight the flow of any business or document processes you need to explain.
Continue reading Present Processes Creatively with Flow Chart DiagramsUse Modern Market Analysis Graphics for Better Presentations
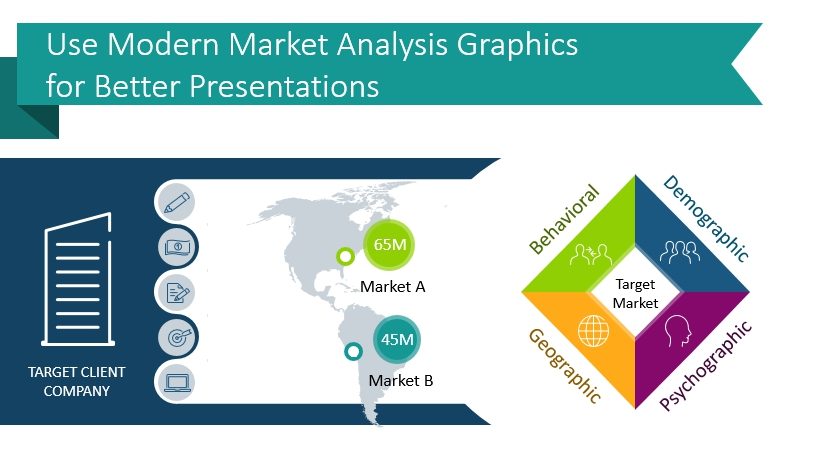
Presenting market research reports or market analysis? You can help your audience understand who your target group is, what the market size looks like, and what the trends are in your competitive market landscape.
Continue reading Use Modern Market Analysis Graphics for Better PresentationsHelp Your Audience Connect the Dots by Presenting Visual Metaphor Bridge Diagrams
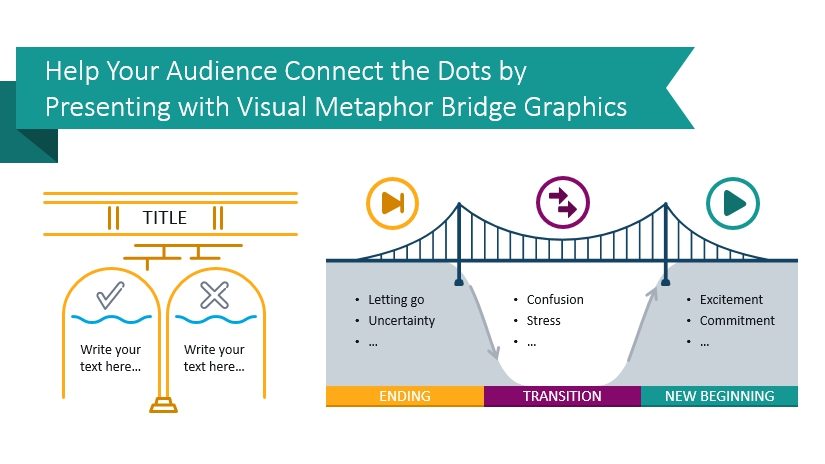
What do you think when you hear the phrase ‘bridge the gap’? This concept has many different applications. Whether you’re bridging the gap between different industries, departments, or teams, or simply connecting two concepts, bridge diagrams can help your audience understand.
Continue reading Help Your Audience Connect the Dots by Presenting Visual Metaphor Bridge DiagramsPresent an Artificial Intelligence Story with Compelling Graphics
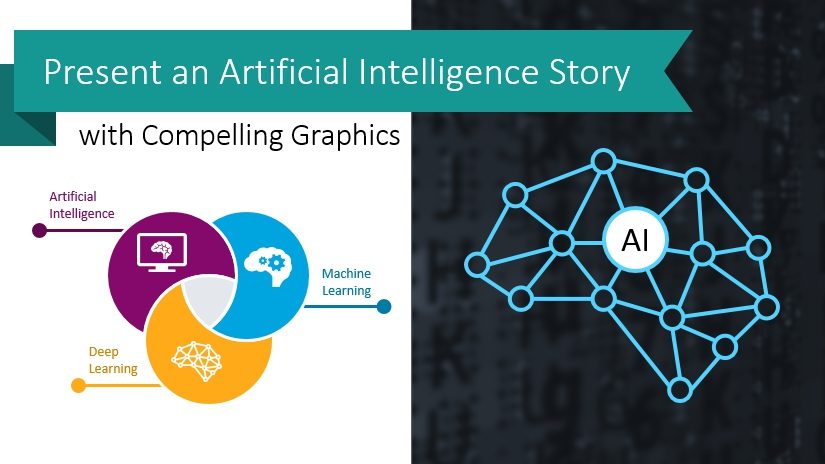
Artificial Intelligence deals with the simulation of intelligent behavior and intelligence in computers and technology. Machine Learning refers to sets of computer algorithms that are able to learn. They are usually not explicitly programmed to do so.
Continue reading Present an Artificial Intelligence Story with Compelling GraphicsUse Modern Graphics to Teach Six Sigma and DMAIC
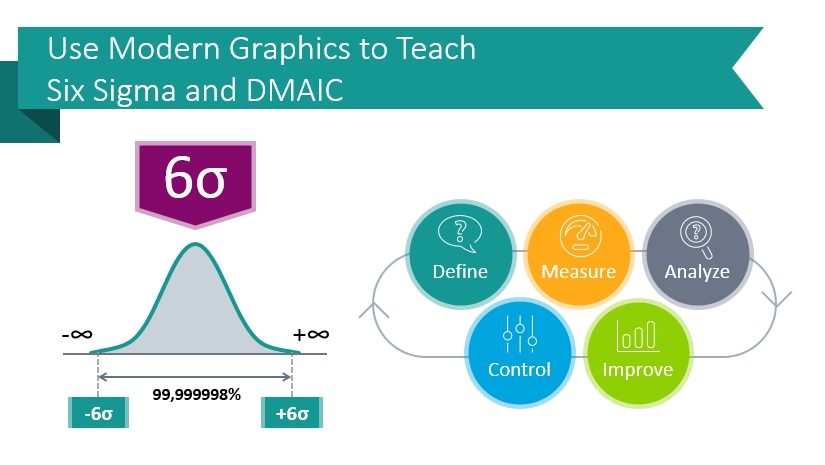
The Six Sigma framework was developed in the 80s by Motorola. The goal was to create a system for quality improvement. Conveying things like the main principle of Six Sigma is to work on decreasing defects in the production process. The goal is to get defects to a level that is not statistically significant. Six Sigma represents a very low probability of event occurrence.
Continue reading Use Modern Graphics to Teach Six Sigma and DMAICExplain Lean Management Principles with Visuals
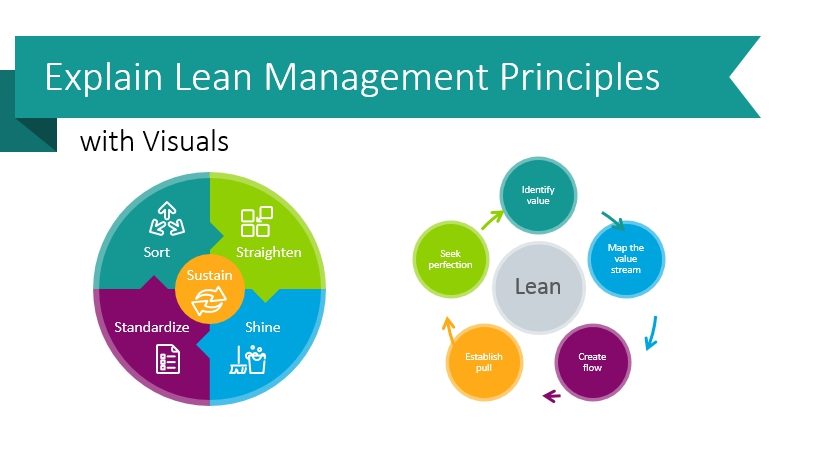
Lean management is a way of managing a company or institution. The goal is to ensure continuous improvement by making small changes in processes and delivering value to customers. An issue people run into when presenting such topics is making them engaging and easy for the audience to digest. Using customized graphics can help audiences relate to the material and retain the information.
Continue reading Explain Lean Management Principles with VisualsUse Creative Data Table Template for PowerPoint to Save Time
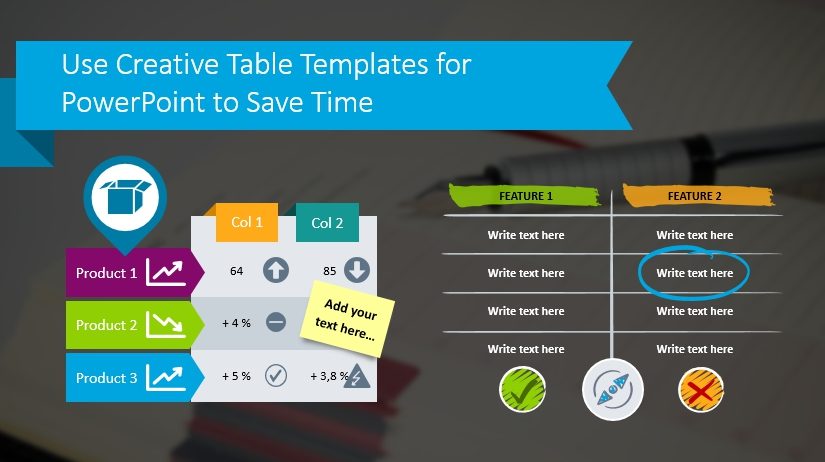
When making data-heavy presentations or sharing dense information, you may wish to use a data table template. Tables are wonderful for helping you keep the information you need to present organized and easy for your audience to follow. However, creating a neat-looking and readable table can be pretty time-consuming. What if you could simply select a ready-made table, customize its content, add your brand colors, and move to the next slide?
Continue reading Use Creative Data Table Template for PowerPoint to Save TimeImprove DevOps Methodology Presentations with Creative Graphics
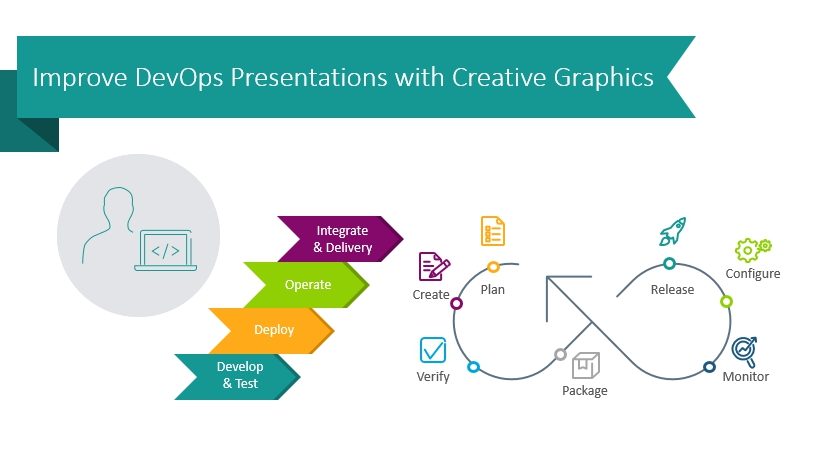
Explaining DevOps methodology concepts and processes can be challenging without the appropriate tools. This PowerPoint template provides the visual toolbox required to effectively demonstrate DevOps concepts, roles, cycles, and levels in ways that are easy to understand.
Continue reading Improve DevOps Methodology Presentations with Creative GraphicsExplain Blockchain Technology Effectively with Modern Graphics
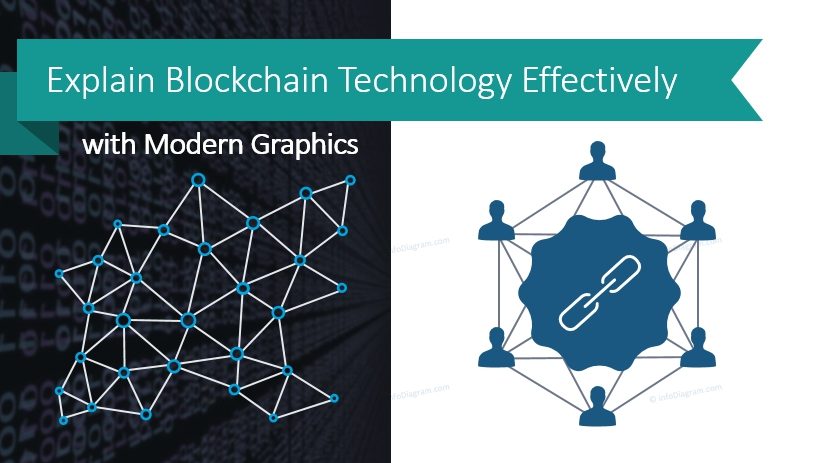
Defining concepts like distributed ledger, block structure, benefits and the applications of blockchain technology in various industries are often necessary for presentations. How do you make the descriptions and definitions come alive?
Continue reading Explain Blockchain Technology Effectively with Modern Graphics
