Data Visualization Makeovers: 2 Steps to Better PowerPoint Charts
Default PowerPoint chart settings often make data harder to understand. Learn 2 simple steps to transform your charts into clear, compelling visuals for any business audience.
In the context of global business presentations I often work with, your data is only as powerful as your audience’s ability to understand it.
Whether you are presenting a quarterly strategy to stakeholders in London or coordinating a cross-functional team meeting in New York, the “default” chart settings in PowerPoint that people often use (because of lack of time or skills) – such data slides are a barrier rather than a bridge to clear communication.
When your colleagues have only seconds to digest complex information, a cluttered chart isn’t just an “eyesore”. It’s a missed opportunity, too. To turn raw data into actionable insights, you need to shift your focus from decoration to readability.
Let me share with you a secret of attractive data charts.
Read more: Data Visualization Makeovers: 2 Steps to Better PowerPoint ChartsQuick Data Slide Transformation Strategy
1. DECLUTTER: The “Less is More” Rule
The first step to a professional chart is removing anything that doesn’t contribute to the core message. Default PowerPoint settings often include “chart junk”—background gradients, heavy gridlines, and redundant legends that distract the eye.
Action: Remove the noise. If the data point is labeled, you likely don’t need the Y-axis. If the bars are distinct, you may not need a legend.
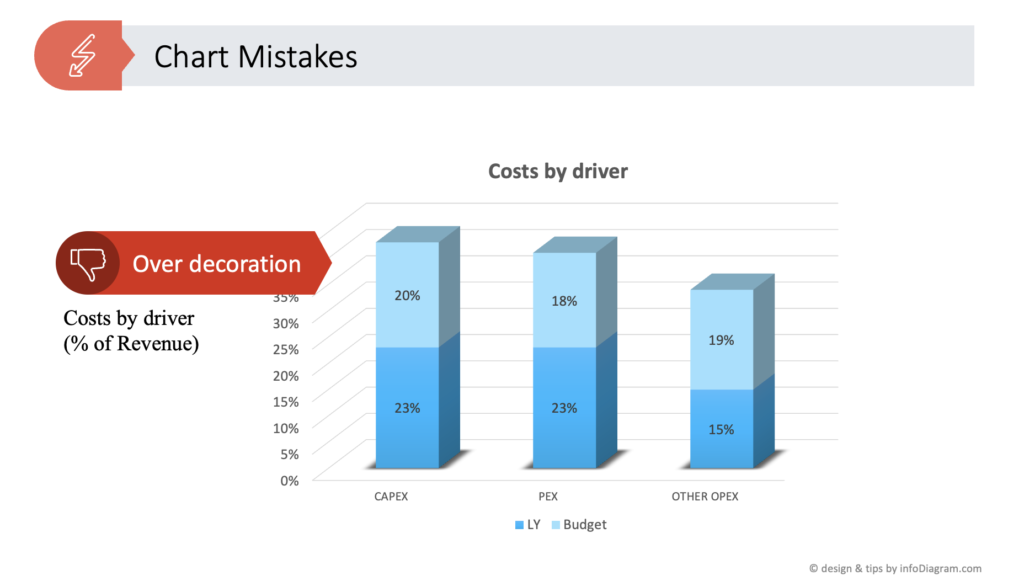
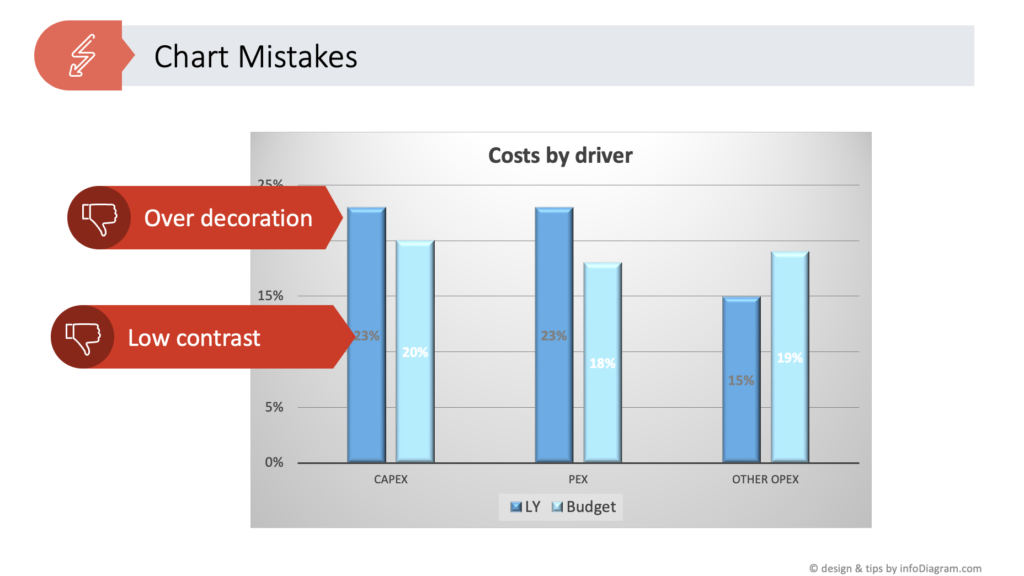
Here are examples of some mistakes chart:
- over-decoration: using 3D bars is really not helping
- double information: when your chart data values are expressed twice – once in a axis and once in data label
- low contrast of data labels
2. FLOW: Directing the Executive Eye
Once the clutter is gone, you must guide your viewer through the data. This is achieved through strategic “flow,” primarily using color as a functional tool rather than a stylistic choice.
- Action: Use color intensity to highlight the most recent data or use specific hues to represent different categories. As seen in our “After” redesign, color isn’t just for aesthetics—it’s a roadmap for the reader’s brain.
Review your next data chart using those two criteria.
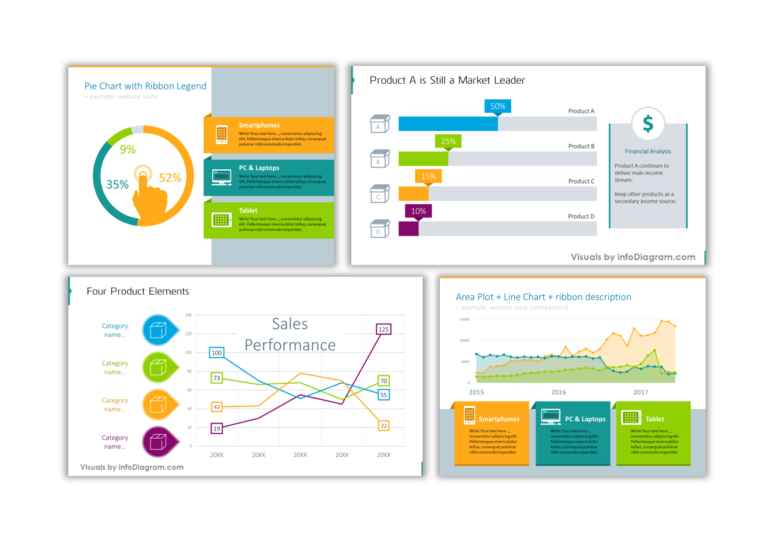
For your inspiration, check the following examples how you can redesign data chart slides:
Enhancing a Bar Chart
Notice how a color coding can help quickly identify data categories – here ESG and total:
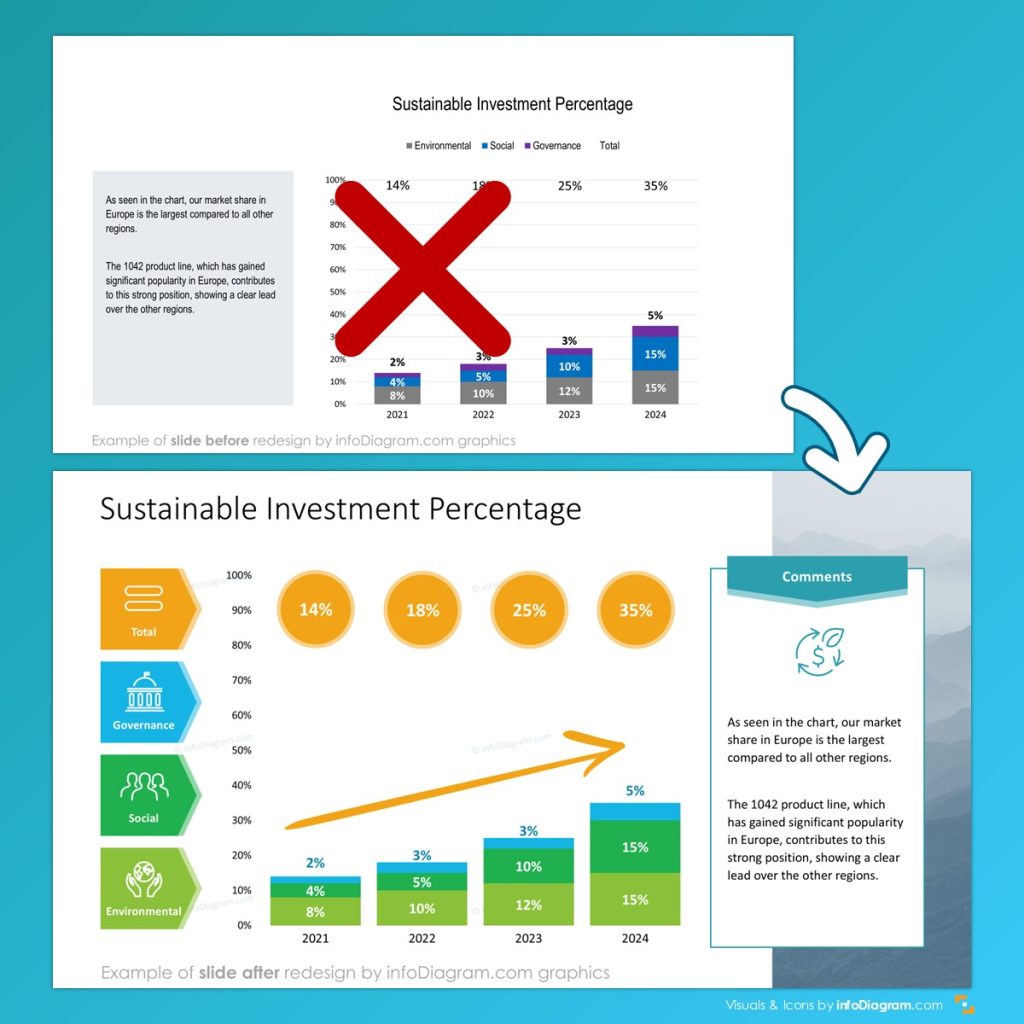
Presenting Score or Ranking Data Slide
PowerPoint allows you to quickly create a customized data scales made of shapes. This gives you great flexibility. See example of our redesign of data slide presenting Sustainalytics ESG score:
Key take-ways: Optimizing Your PowerPoint Data Chart for Professional Slides
At the end of the day, your slides are a support tool for your leadership. By applying the Declutter and Flow criteria, you transform “ugly” default charts into professional assets that respect your audience’s time.
To ensure every data chart on your PowerPoint slide meets a high corporate standard, keep these five essential redesign tips in mind:
- Maintain Visual Consistency: Use a unified color palette and font style across your entire deck. Consistency builds professional authority and prevents the audience from being distracted by shifting styles.
- Leverage High Contrast: Use a bold “action color” for the most important data point while keeping the rest of the chart in neutral tones (like light gray). This creates an immediate focal point.
- Establish a Logical Reading Flow: Align your titles, data labels, and annotations to guide the eye from the “what” to the “so what.” A well-structured chart should be readable in under five seconds.
- Eliminate Redundancy: If your data bars are labeled with values, remove the vertical axis. If your title explains the categories, remove the legend. Every pixel on your slide should have a purpose.
- Prioritize White Space: Don’t be afraid of “empty” space. Giving your data chart room to breathe makes the information feel less overwhelming and more “executive-ready.”
Before you hit “Save” on your next deck, review your work: Have you removed the unnecessary? Does the color tell the story for you? Making these small adjustments ensures your data doesn’t just sit on the screen—it speaks.
Further Reading about Data Slide Visualization
Mastering the art of visual communication is a journey. To help you dive deeper into specific visualization challenges explore our other articles with examples of data presentations:
- Beautify Your Bar Charts in Simple Steps: A deep dive into making one of the most common chart types look world-class.
- Top Chart Mistakes to Avoid in PowerPoint: Are you making these common data visualization errors? Learn how to spot and fix them.
- Perfecting Your PPT Chart Styles: A guide to selecting the right style for your corporate brand and message.
Follow our YouTube channel if you want to see more of such guides, and subscribe to the newsletter to get more design tips and slide inspiration.
Author: Peter Zvirinsky, slide design trainer and the founder of infoDiagram
Reach out to Peter on LinkedIn or via his slide design & training website.