Illustrating Supply Chain Presentation
The topic of Supply Chain is pretty complex – with all global or local logistics processes, ensuring just on time delivery and enough stocks in warehouses. Therefore using illustrations to explain it is really handy. Good news is that most SCM processes are easy to visualize. We gathered a few examples of how you can illustrate a supply chain presentation. Easily and quickly, using only PowerPoint tools.
Even though logistics management may be not a trivial one, it has is one advantage. It’s literally down to Earth 🙂 . Just compare it to other abstract topics like IT or a law. In logistics, all takes place in a real world, in specific places on a map. And that’s not that hard to visualize.
Remark: You can get all diagrams and icons from Supply Chain and Logistics Visuals Toolbox.
What supply chain concepts you can illustrate?
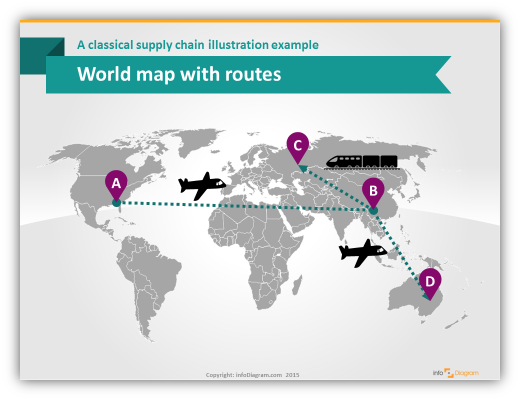
Visualizing Classical Logistics Routes on a Map
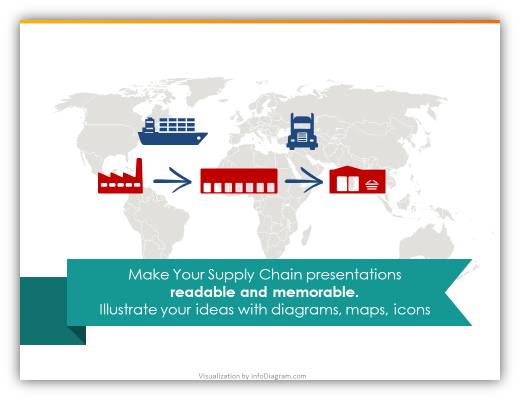
This is easy. Use a map picture in the slide background (put the map object to the very back). Add standard PowerPoint line arrows. Here I used a dot and arrow endings. Illustrate routes with icons and labels to mark the destination places and transport means.
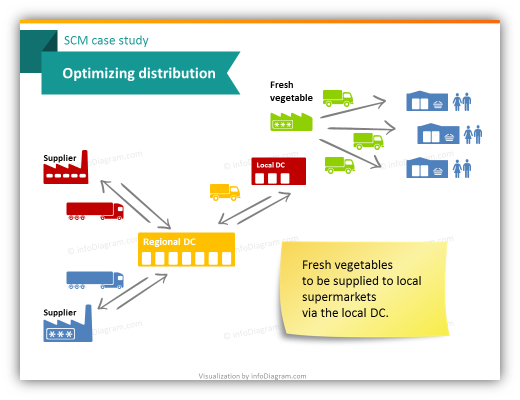
Comment in a Visually Interesting Way
You can add a comment to explain what’s happening in your logistics process. Telling a story is the best way to pass your message.

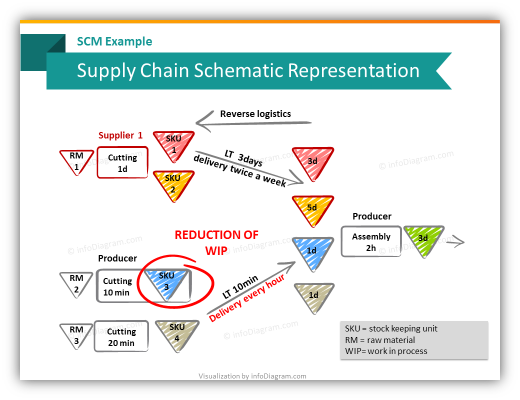
Illustrate a Schema
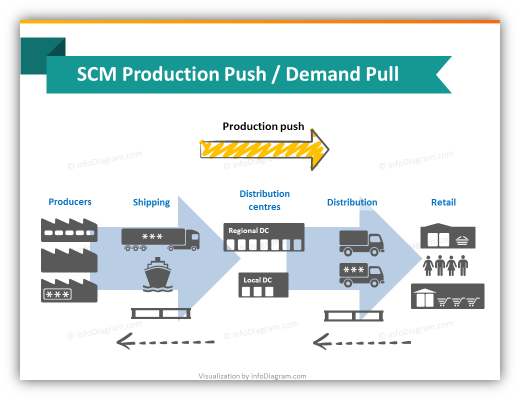
An abstract supply chain processes can be nicely illustrated. You can use normal PowerPoint shapes (triangles, arrows) or use more original sketched shapes:
Close with a Quote
Adding a quote is a great way to open or close the presentation. Here’s a citation I like, on the importance of describing processes. And the best way to describe any process is by drawing it.

Take Away – Illustrate SCM to be Understood and Remembered
So if you work in a retail chain or production company and you are about to present your supply chain systems, get inspired by the examples above. Replace your text information in your PowerPoint with pictures and maps illustrating your processes. Make it easier to understand, to remember.
Reuse Your SCM Illustrations
Once you have nice the illustrations, go beyond your slides. Copy the SCM diagrams to your webpage, leaflet or any other publications.
Editable Logistics shapes will help you to visualize supply chain management concepts, from different production facilities, through stocks and distribution centers, various transport means and finishing retail stores. You can also use them to illustrate distribution flows or any supply chain models using formal standard methodology.
Resources: Supply Chain Diagram
Supply Chain and Logistics schema diagrams and pictogram icons include:
- 42 SCM pictograms (factories, transport, distribution, stores, maps)
- 37 schematic shapes for modeling any Supply Chain according to the industry-standard methodology
- 2 graphical styles: free handwritten style and gradient
- 4 reallife supply chain management examples
If you like the slide examples above, you can download them directly here:
If you want to get more graphics for your presentation, check this Logistics PPT icons: Transport, Supply Chain Management, SCM, Location Pins.
Here’s an example of using a Slideshare as another publication channel:


