Sales Funnel Graphics Are a Shortcut to Presentation Engagement
When presenting to your team or another department, it can be difficult to capture the attention of your audience. The struggle is often based in the need to make more engaging presentations, more so than a lack of interest or effort on the part of the presenter. We’ve found that explaining concepts such as sales funnel with graphics not only makes the presentation more visually engaging but helps to clarify what might otherwise be a difficult concept.
(In this particular case, it’s an obvious choice. Sales funnel chart graphics are a shortcut to presentation engagement. The sales funnel concept was created to be a VISUAL representation of your selling process. Why wouldn’t you try to make your presentation visually appealing? Simply presenting the information isn’t sufficient!)
Remark: You can get all diagrams and icons from Sales Funnel Diagram.
Why Illustrate Sales Funnels?
Sure, sales funnels are meant to track conversion of a lead into a paying client. Seems simple enough, right? That’s where considering your audience comes into play. Unfortunately, some individuals are prone to struggling with the idea if it’s not presented visually. Others are apt to get confused if the funnel is explained with a simple, unlabeled graphics. We’ve found that audiences benefit most from having a clearly labeled diagram to illustrate exactly what is taking place. When you include clear, labeled graphics, you immediately make more engaging presentations.
To make it perfectly clear to everyone present, you should illustrate your sales funnel step by step. As you do in your actual sales strategy, each stage of the funnel graphic should correspond to various stages of lead development. These different stages should be clearly marked.
See how each level is clearly indicated as a different step? See how easy it is for anyone watching the presentation to understand the material? Adding labels helps viewers to digest the material and appreciate what is being said. When people understand what is being offered in your presentation they can focus on the meaning, rather than try to figure it out for themselves and missing portions of your talk.
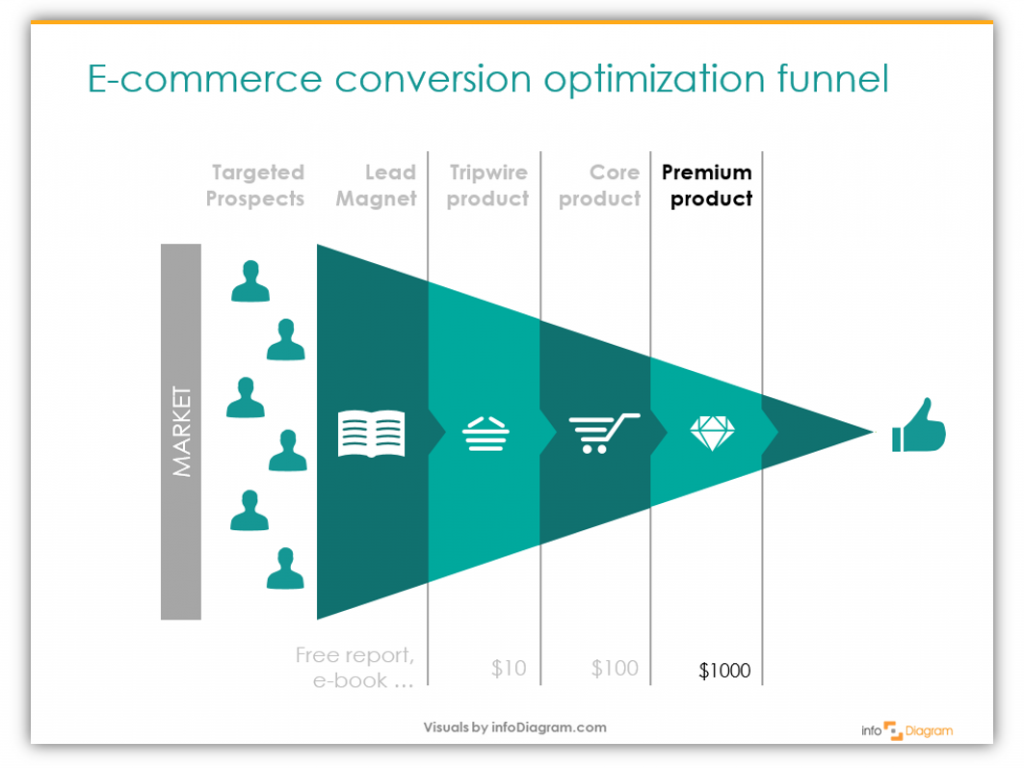
What’s great about using illustrations is that it doesn’t matter if you’re presenting a general sales funnel model or are working on specific funnel structures for different divisions (B2B Prospects versus general sales activities, for example), an image will help in every case. There are even ways to illustrate and highlight the different activities and elements of more complex eCommerce optimization funnels. (For example, in infoDiagram sales funnel illustrations, you can add custom labels to each segment to better present information.)
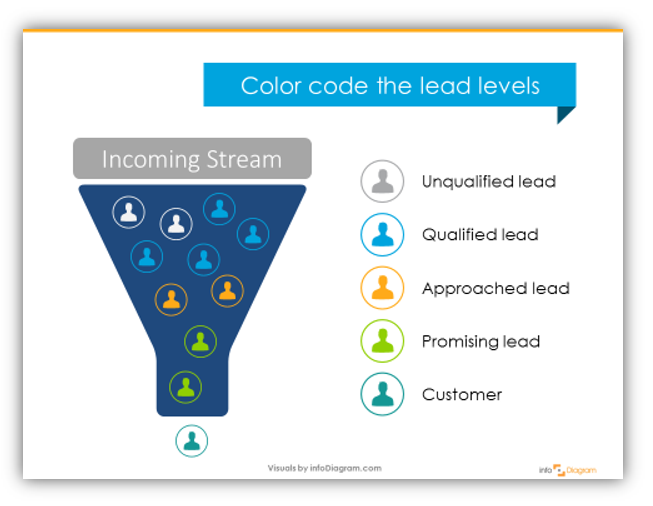
To make your diagrams even more dynamic and even easier to interpret, you can color code them in addition to customizing the labels.
Get Creative With Sales Funnels
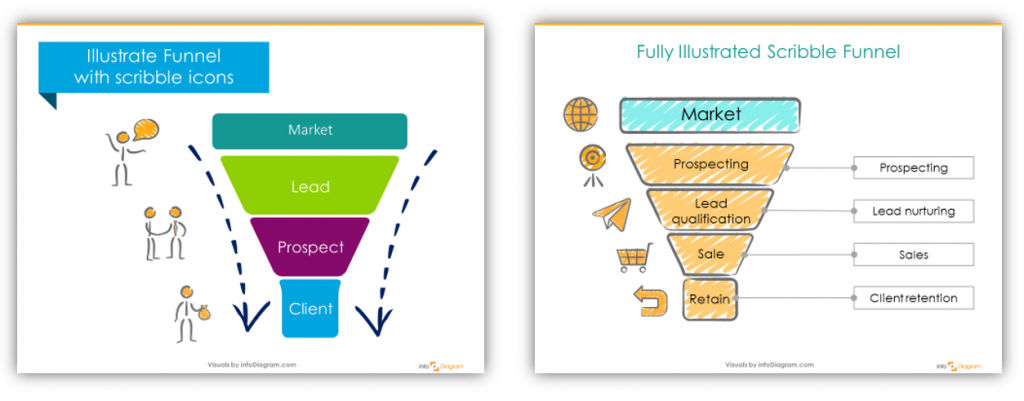
Want to add some flair? You can make your presentation more interesting if you put your mind to it. Don’t be afraid to get creative! We offer scribble icons and figures which can help you illustrate the differences between stages. Want to do the whole presentation in scribble style? We can help with that, too. Then you get the benefit of a playful element and consistency to make a dry presentation more interesting.
Resources: Sales Funnel Diagram Pipeline Selling Process
The collection contains template slides with various marketing and sales funnel process diagrams:
- Sales funnel with a definition
- Five stages of B2B sales funnel: Prospecting talks, Meeting – Sales proposal, Negotiation, Project delivery, Close – Payment
- Three and four level funnel with scribble icons
- E-commerce conversion optimization sales funnel
- Funneling leads, lead evolution funnel
- Sales persona and funnel, sales persona profile
If you like the slide examples above, you can download them directly here:
Here’s an example of how you can present an animated sales funnel. I added a simple animation to uncover each sales stage one by one. This gives a speaker space to talk about each stage.
Take away
When you’ll be talking about your sales or marketing process next time, consider
- presenting the sales process in a graphical form of a diagram. You will show the bigger picture to your audience about the whole process.
- illustrate the sale stages using color coding and symbols to create better mental associations
- animate the sales funnel graphics for better attention focus – simply uncover each funnel elements one by one.
For more inspiration on presenting sales and marketing, you should check out these articles:
- How to illustrate a Customer Opinion and NPS in a presentation
- How to visualize Customer Segments
- How to Show Benefits Creatively
Need more help making your sales funnel presentation engaging? Working on another presentation and aren’t sure what will help?
Comment here or send an inquiry through the contact form. We’d love to help you create more dynamic presentations, eBooks, pamphlets, or whatever else you’re working on!


