BCG Matrix Definition and Examples [presentation infographics]
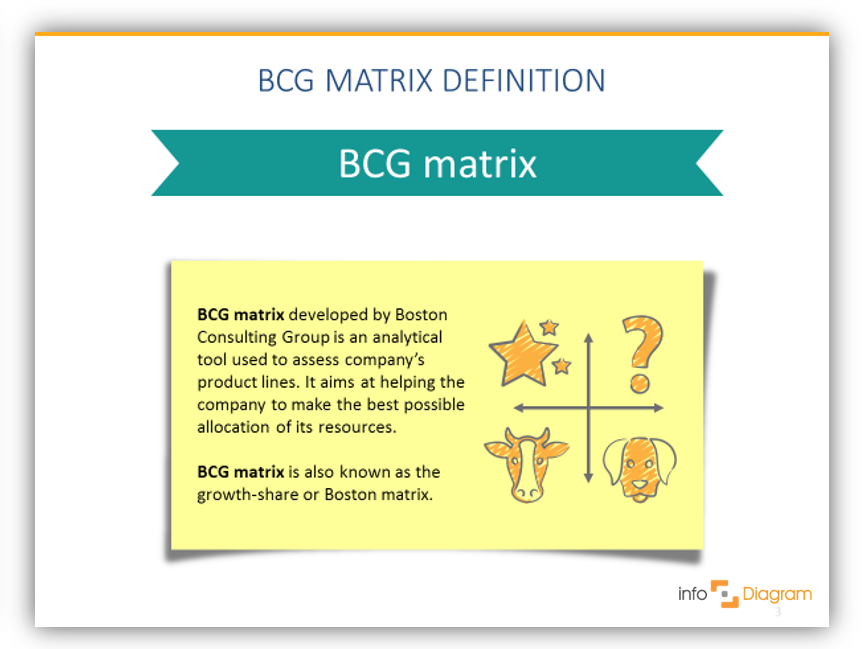
The Boston Consulting Group’s product portfolio matrix (BCG) is designed to help with long-term strategic planning, to help a business consider growth opportunities by reviewing its portfolio of products to decide where to invest, discontinue, or develop products. Since 1968, the BCG matrix, also known as the Boston or growth-share matrix, has been a tool to answer those questions by providing them with a way to analyze product lines in search of growth opportunities.
Explore our Business Performance PPT Reports category on the website for more resources to boost your presentation impact.
We designed the BCG Matrix Product Portfolio Model Diagram collection, to help you visualize the identification of high-growth prospects by categorizing the company’s products according to growth rate and market share. Good visual presentation of BCG analysis assists in properly allocating company resources.
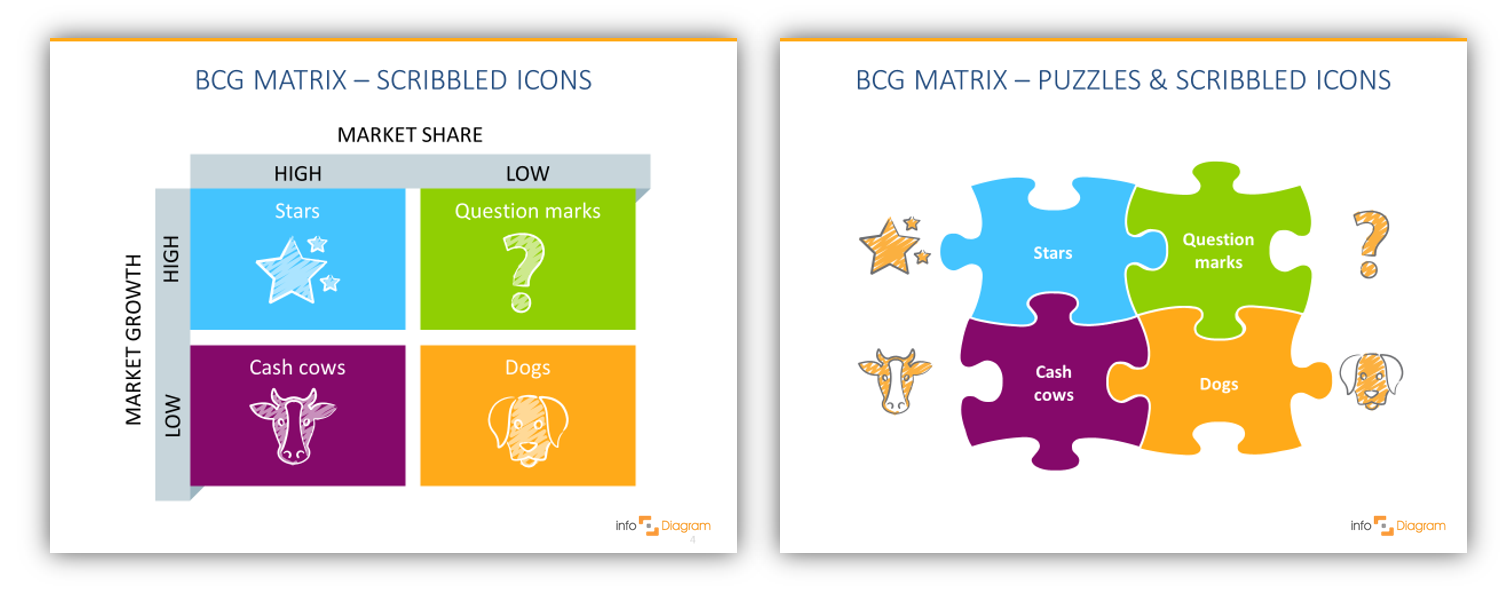
The BCG matrix model is divided into 4 quadrants derived from market growth and relative market share: Stars, Cash Cows, Question Marks, and Dogs. Let’s have a look at what each one means for the product and the decision-making process.
- Stars (high share and high growth):
Star products all have rapid growth and dominant market share. This means that star products can be seen as market-leading products. These products will need a lot of investment to retain their position, to support further growth as well as to maintain its lead over competing products. This being said, star products will also be generating a lot of income due to the strength they have in the market.
- Cash Cows (high share, low growth)
Cash cows don’t need the same level of support as before. This is due to less competitive pressures with a low growth market and they usually enjoy a dominant position that has been generated from economies of scale. Cash cows are still generating a significant level of income but not costing the organization much to maintain. These products can be ‘milked’ to fund Star products.
- Dogs (low share, low growth)
Product classified as dogs always have a weak market share in a low-growth market. These products are very likely making a loss or a very low profit at best. These products can be a big drain on management time and resources. The question for managers is whether the investment currently being spent on keeping these products alive could be spent on making something that would be more profitable. The answer to this question is usually yes.
- Question Markets (low share, high growth)
Also sometimes referred to as Problem Children, these products prove to be tricky ones for product managers. These products are in a high growth market but do not seem to have a high share of the market. The could be the reason for this such as a very new product to the market. If this is not the case, then some questions need to be asked. What is the organization doing wrong? What are competitors doing right? It could be that these products just need more investment behind them to become Stars.
Definition and detailed explanation of BGG matrix and the four elements can be found in this article.
BCG Matrix Product Portfolio Model Diagram PPT collection consists of 13 diagrams and 10 icons (modern flat icons symbols for infographics and personal hand drawn scribble graphics), which are fully editable as can be seen in the slide below:
What can you find in our BCG infographics set?
- Definition of BCG matrix, its aims.
- Scribbled icons and square ribbons, representing 4 groups: Stars, Cash Cows, Question Marks, and Dogs, with detailed characteristics of each group.
- BCG matrix showed as a puzzle.
- A colorful overview of the growth-share matrix.
What’s more, in the collection you can find several options for showing four quadrants together (i.e. puzzles):
However, what can be better than testing yourself? Explore all the BCG diagrams on the infoDiagram website.
Check our YouTube movie with examples of how you can illustrate BCG Matrix concept:
How to get BCG Matrix infographics?
You can get those BCG diagrams and icons as editable PowerPoint slides in several ways:
- if you need a few of them, you can choose any single slide when joining our infoDiagram membership slide graphics subscription. This allows you to choose any slide from this Simple icon collection or any other presentation from the infoDiagram website.
- or get all 13 diagrams and 10 icons to make your marketing or sales presentation with a single pay-as-you-go purchase.
Presentation template is suitable for marketing and business development presentations. Set consists of various diagrams representing four distinct product groups: Stars, Cash Cows, Question Marks and Dogs.
More ideas for presentation graphics
Check out these articles if you search for more inspiration on how to visualize your presentation:
- Do it Yourself presentation infographics using Simple Flat Icons library
- 3 diagram mistakes to avoid in slides design
- Porter’s Five Forces Diagram Infographics Presentation
Want to be notified when we make an announcement? Never miss out on creative presentation graphics and stay informed about our latest updates and news. We’ll also send you a Creative slide design guide with FREE hand-drawn shapes for you to begin using right away!


