Illustrating Resources, Energy and Agriculture Presentation
Talking about energy resources or agriculture topics? Illustrating natural and alternative energy operations, or food production flowcharts can be challenging. Especially when you rely on images from the standard sets of clip art. There’s a lack of consistent symbols set that would cover in detail all types of resources, energy and agriculture.
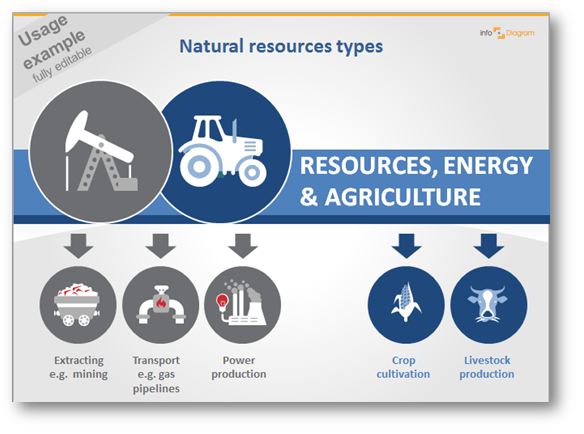
To help out with representing various kinds of resources we use, we designed a series of PowerPoint charts and symbols that can easily be added to presentation slides. Ranging from power production, mining, gas transporting, forestry, to fishery or agriculture industry, check below what you can find there.
Using Energy Icons to Enhance PowerPoint Charts
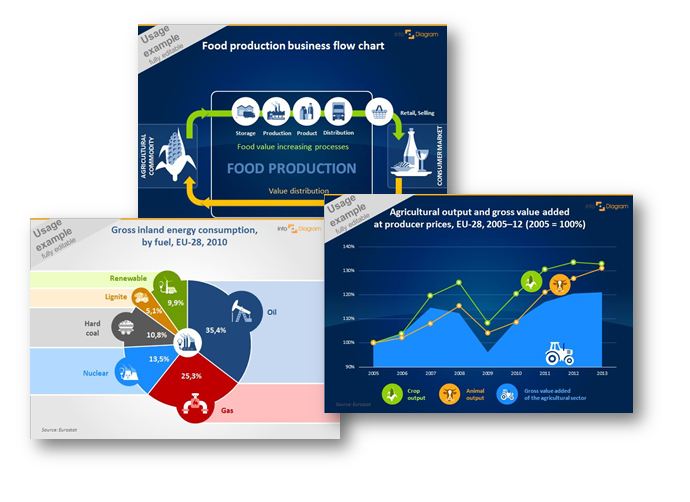
Sitting on a presentation you surely noticed that looking at the next and next default chart gets boring pretty soon. To keep attention, it’s good to vary the look of your presentation. You can enhance the look of standard charts quickly by adding specific energy or agriculture commodity icon next to the data bar chart. Or illustrating the food production flowchart process with pictures.
Show energy consumption or create an outstanding chart to show the gross value added at producer prices (concerning agriculture as in the example).
Besides adding the icons to PowerPoint slides, you can use them also in other documents – eBooks, Excel sheets, also Keynote, Prezi, and other tools. For MS Office apps a simple copy & paste of the data chart or symbols will work. For other tools (Canva, Prezi..) saving icons as an image and adding them as a picture will do the work too.
See these mini step by step illustrations uncovering the charts enhanced by the icons:
What’s inside the resources, energy, and agriculture icons set?
The icons are completely customizable. You can choose colors to correspond with your brand, the color scheme, and the layout of your presentation, or create natural-looking icons with numerous colors. All symbols, charts, and diagrams are editable vector artwork so you can adjust them as needed, using standard PowerPoint tools. And they remain razor-sharp also if you resize them, unlike bitmap pictures.
Energy icons collection consists of:
- Mining and quarrying industry icons: Mining, Hard coal, Quarrying, Lignite symbols
- Oil & gas industry pictograms: Petroleum (Crude oil) / Pumpjack, Gasoline / Fuel, Natural gas / Pipeline symbols
- Energy production symbols: Power engineering / Power station, Renewable energy (Wind, Solar), Nuclear energy symbols
- Agriculture segment icons: Crop cultivation, Livestock production symbols
- Forestry & fishery symbols
Resources, energy and agriculture icon collection is a part of wider industries icons bundle, which contains various industry segments pictograms.
Set contains icons for visualizing economical and industry-specific topics. All symbols are as clipart pictures – fully editable in PowerPoint.
Further articles on presentation graphics
For more inspiration on using visuals in your presentations, or on how to implement graphics in an engaging way, check out these helpful articles:
Get notified about new creative presentation graphics. We’ll also send you a Creative slide design guide with hand drawn shapes for you to begin using right away!


