Making of Retail Business Update Presentation
Do you recall the last presentation you’ve seen about business status? You know, the quarterly review meeting or annual company summary? Often those presentations look not very attractive. With a few simple design tricks, you can make such We demonstrate it in the retail business case, however, you can reuse the same ideas for any other industry.
Remark: You can get all diagrams and icons from Retail Update Presentation Review Template.
Business review presentation usually contains those parts:
- Agenda and some form of an executive summary
- Market insight and market dynamics
- Competitors highlights
- Financial data snapshot and financial year outlook
- Activities overview
- Key focus and key challenges
- Goals achievements sum up
If you are in the retail sector, you can have a few more retail business specific topics, like retail footprint data, shop specific KPIs, and objectives.
You may have already a given corporate presentation template. But you can make it more unique by adding a few simple design elements. These are light changes that will not break your brand guidelines. If you will apply neutral style symbols and recolor them to your company colors, you will get a nice look consistent with your brand. So your marketing people will be happy, too.
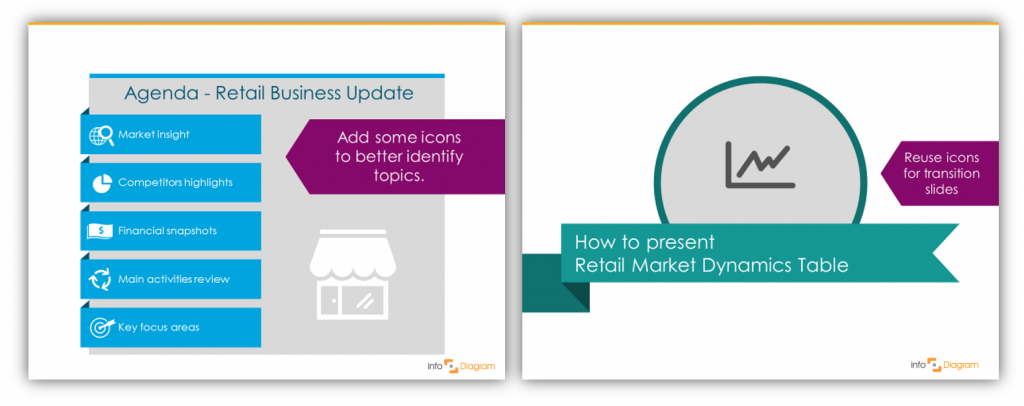
1. Remaking Business Agenda
Firstly let’s see how we can enrich the classical agenda slide. Redo bullet points to a set of shapes (or get creative and make hand drawn style agenda).
Add simple icons for each area to create a visual association. A good idea is to reuse the same topic icons for section slides, to make the nice transition:
 2. Facelifting Market Dynamics Tables
When you have a slide with a table containing data e.g. about market dynamics, such table can also be easily enriched by a set of simple shapes and icons to look more attractive. If the table is not too dense (up to 6-7 rows), you may add there also icons for each area.
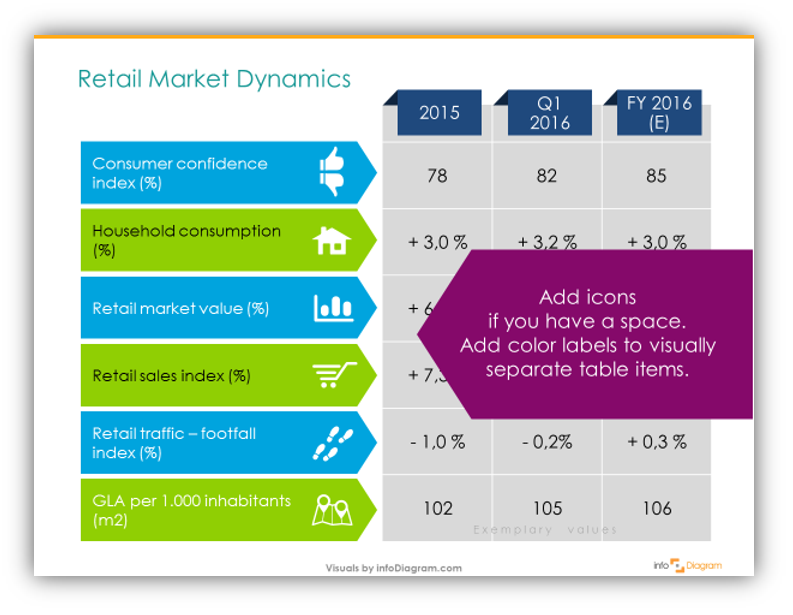
If you have more rows, usually there is no more space for additional symbols. Then it’s better to keep it simple, only recolor columns and rows to keep them readable. Don’t forget to set up cell margins so the text will not be too close to table borders.
Here is an example of such a dense table, typically Profit and Loss snapshot table is one of them. You can add only 2-3 icons here, in the corner. Optionally you can use colors to code the similar costs and expenses areas, for example.
Similar way you can illustrate finance and market concepts such as market revenue, P&L, cost, profit, OPEX expenses, EBIT earnings, taxes efficiency indicators, you name it :).
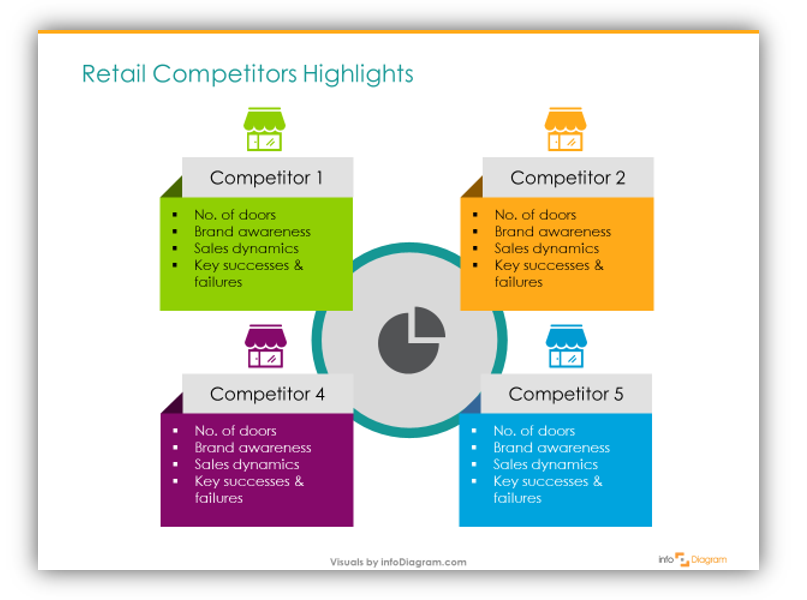
3. Compare Competition Using Diagrams
In the case of comparisons, e.g. comparing your competitors or partners, I suggest to go for diagrams – put each competitor in a separate box. It can be a simple PowerPoint shape. Then copy it for each subject and distribute and align them equally over the slide space:
4. Adding Retail Business Specific Symbols
If this is a retail business or other industry sector presentation, you may want to add your industry-specific symbols to selected slides.
In the case of retail, add a shop symbol in the competitor highlights, use a map and location icons in the retail footprint data.
Below are ideas of icons illustrating retail area:
All these symbols from the retail icon library are the vector symbols in PPT format. So you can open and recolor them using standard Powerpoint or Keynote tools.
Make the Presentation Alive
Having such a presentation in PowerPoint, with a few more additions (adding animations and transitions) you can change it into a nice dynamic movie. With MS Office 2013 and newer, you can export such slideshow into a movie format (for example WMV or AVI).
See our movie example on Youtube:
Source of retail business update visuals
All presented slides were made in PowerPoint using the Retail Business Update PPT template graphics. If you miss any symbol, let me know, leave a comment below or contact us by our contact page.
How to best get 1, 10 or all retail flat icons?
You can get those icons in several ways:
- if you need a few of them, you can choose any single slide when joining our infoDiagram membership slide graphics subscription. This allows you to choose any slide from this retail collection or any other presentation from infoDiagram website.
- or get all 25 retail diagrams and 46 icons with a single pay-as-you-go purchase.
If you want to try a few icons first, get our free Creative slide design guide with a few flat and hand drawn PPT graphics.
Retail Business Update Review presentation template contains graphics for showing a summary of company events, shops performance key financial data, performance indicators and goals achievement:
Further articles on presentation graphics
For more inspiration on using visuals in your presentations, check out also those articles:


