Infographics Ideas: How to make vertical infographic in PowerPoint
Visualizations act as a campfire around which we gather to tell stories.
– Al Shalloway
Visualization is a powerful way to simplify data that is hard to understand and show it in an insightful form.
Have you ever thought about creating an attractive vertical infographic yourself? You can do it pretty fast using only PowerPoint and I will show how easy it is.
Pictures are everywhere around us: we observe them while surfing Facebook, Pinterest, or simply going down the street and noticing ads. However, a lot of them seem designer-made and too fancy to make on your own.
Don’t be afraid of creating infographics
A lot of people simply fear they will fail and the result won’t be as great as they imagined. I suggest you give it a try. You may not make a wonderful one on the first try, but it still can be better than a plain text document. And with the next and next try, you will see the difference.
In this blog, I will show the template you can use to design a simple vertical infographic. Using it, adapt content to your needs and finally export it as a picture that you can add to your webpage, blog, or social media channels. Sounds good and handy, right?
Vertical Infographic Presentation Template – how it looks like
In order to make infographics in PowerPoint, you can choose two ways.
- Design it yourself from scratch – changing the slide format and adding content to the layout you prepare. Beautify it with icons, diagrams, and MS Office data charts. See our detailed video instruction in the section below.
- Reuse some of the already existing infographics templates. Here we show the example of the template we prepared. Use it as an inspiration or get it from us.
The picture below shows the whole template, put together. Further, we will break it into small parts and see what’s inside.
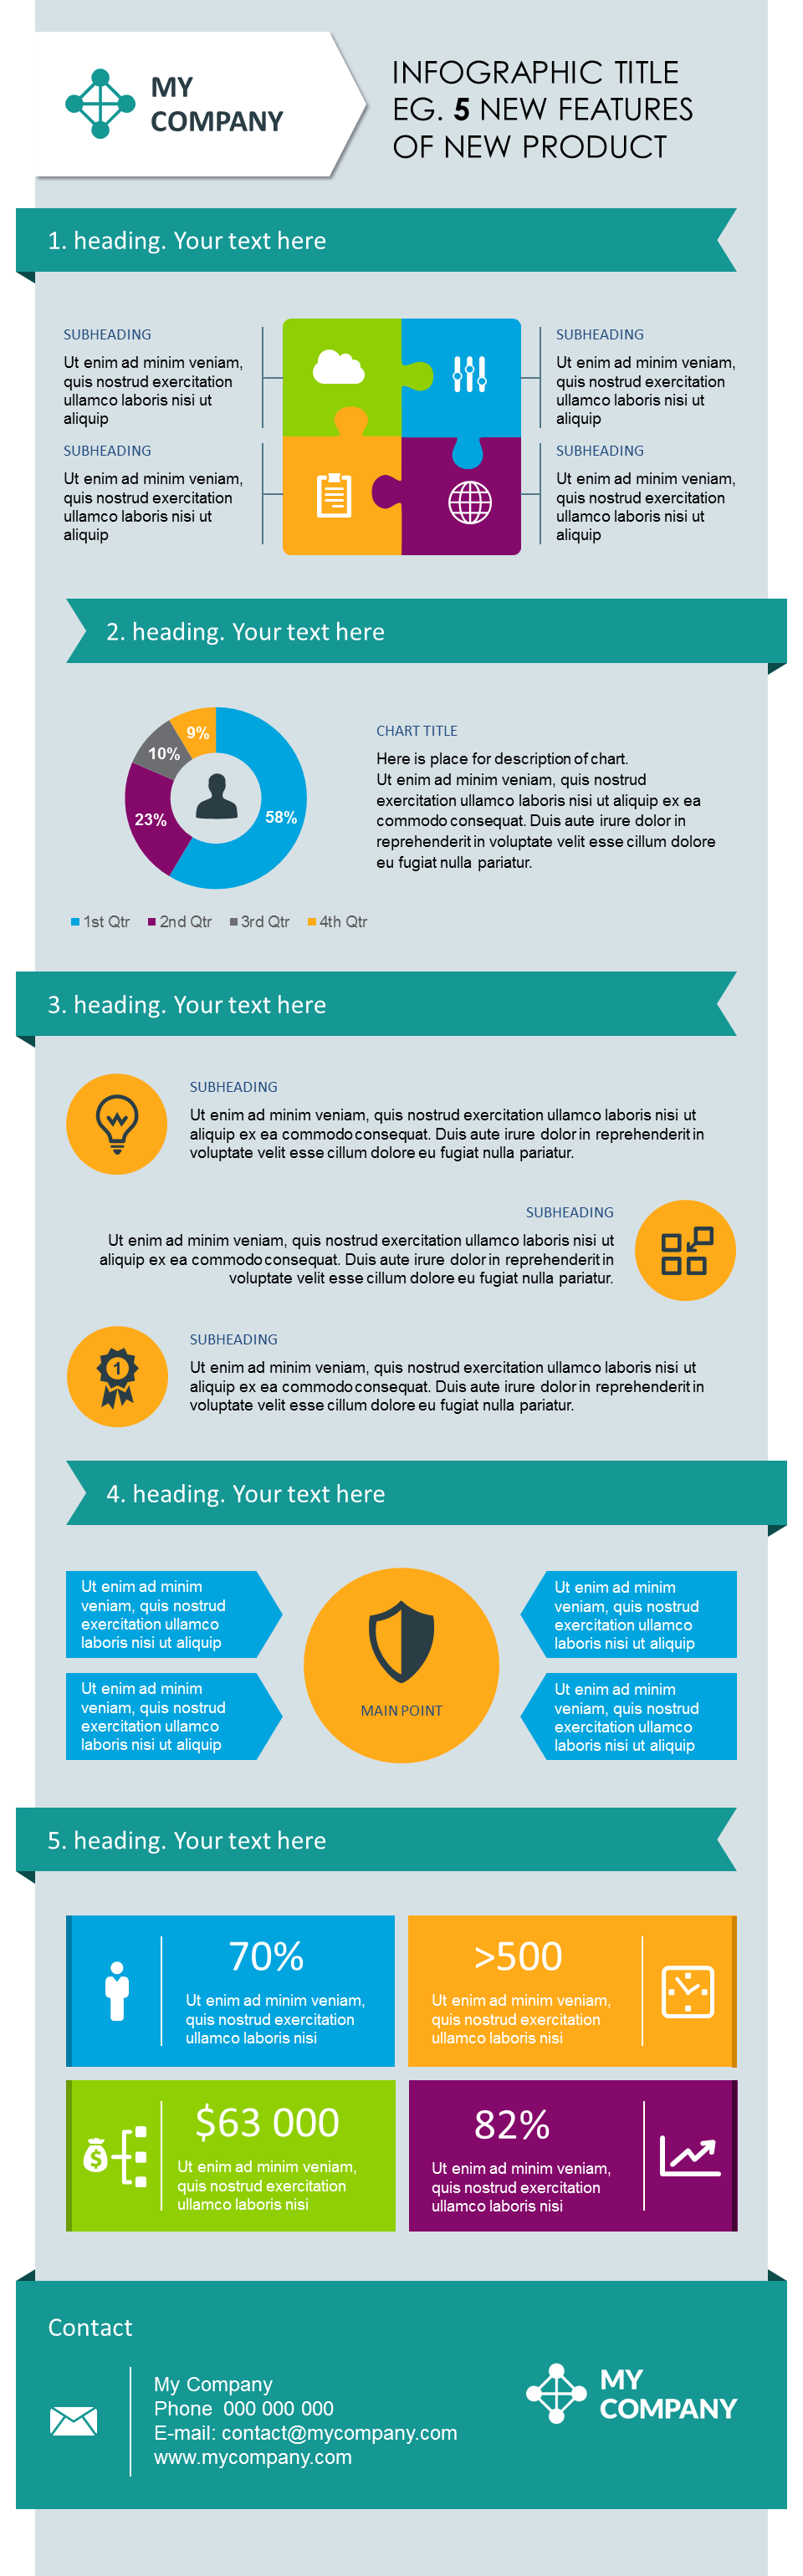
Parts 1 and 2 – presenting features of the product and creating pie charts
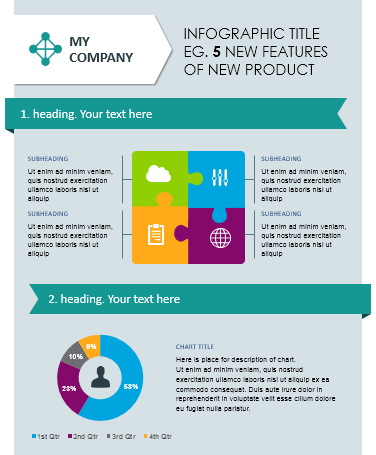
Here’s how you can show your text information in a new way. With the help of simple shapes (puzzle diagram and pie chart), the data looks way better than it would in the black and white table. You can easily change numbers and adjust colors to your brand ones in the template.
Parts 3 and 4 – making creative lists and catching the audience’s attention on the main point
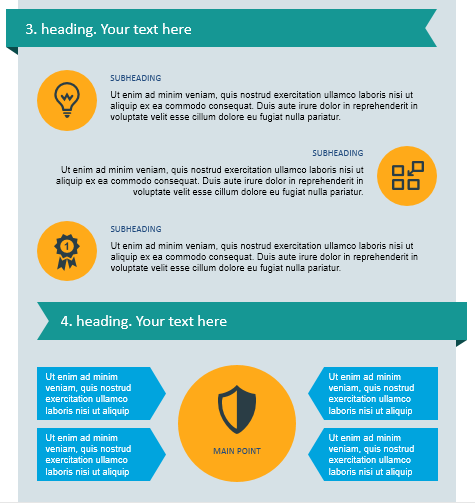
Personally, I am tired of seeing endless bullet points or lists even without them. That’s why I propose a proven way of showing the list without actually creating one. Take a look at the picture above and notice that if you put the text on two sides and add icons – it will look more catchy.
On the next slide, attention is attached to one central point (a product / a client / what you need) and is nicely surrounded by description text. You can show the features of your “client-centric” service or product this way.
Part 5 – showing key numbers and statistics
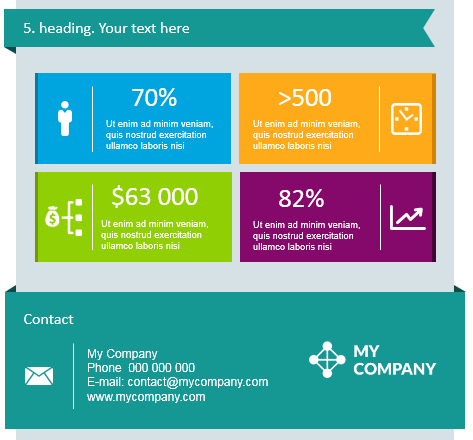
Why statistics are so boring? Well, maybe they are not if presented in a proper way.
If you need to show the volume of products sold, the value of shares, the size of profit or to emphasize the percent of growth – you can’t avoid using numbers. But even simple numbers in colorful boxes and with icons near are better, than bare figures. It’s your choice 🙂
Ending infographics with a message
I recommend finishing the infographics with a message you want a reader or listener to remember. Repeat the key number or a call to action. Make it big and bold. And don’t forget to leave a contact.
Our designers added there a predesigned section for the contact information in the template. You can easily change it to yours there.
Where you can use PPT vertical infographic
There are many ways you can apply similar infographics, depending on our content. The types of infographics you can use:
- create comparison infographics – presenting various qualitative (texts) and quantitative (numbers) information:

- show a product development roadmap infographics or milestones of a project (use numbering or little flags for years or milestones over time)

- presenting enumeration list infographics of your product or service, its benefits, features, financial values, and marketing reviews.
- showing quarter and annual reports as key data infographics and bringing clarity to your presentation. End with a call to action and contact information.
- showing market shares (you can compare two or three of them), sales quotas, and costs, then elaborate by dive-in infographics going into detail about some of the critical areas. Finish such infographics with a summary bottom line.
The final infographics made in PowerPoint can be easily exported into other formats, such as PDF or a bitmap picture (using Save As function). A few common ways infographics are applied:
- inserting information into your website or blog (exporting to PNG bitmap format) as an attractive way to pass information about your product or service
- sending it as an email attachment (exporting to PDF)
- publishing it on Slideshare.net as public infographics (best is to export 1st to PDF, to ensure good images quality also if you use untypical fonts)
How-to guides to inspire you on designing your own infographics
Need more ideas for designing creative, effective pictures and presentations? Check out our articles (actually, they are more like clear instructions) and get inspired on creating something great in Powerpoint: How to create infographics in PowerPoint – part first and part second.
If you have time, I invite you to watch this youtube video with the detailed step-by-step guide.
https://youtu.be/XQvIAWh6FLc
This is how you can make your statistics or any data look better. At the same time, Tall Infographics template can be used to design simple infographics and export them as a picture to be added to your webpage, blog, or social media channels.
Resources for making infographics
Places to get more examples of infographics:
- 10 Best infographics showcase 2016
- Creative PPT Shapes and Diagrams – search for ideas on Pinterest
Simple icons for infographics
And to get our Tall Infographics PPT Template presented above:
If you want to put infographics inside your website, blog, or presentation, there are two possible ways:
- Create it yourself – changing the slide format and adding content to the layout you prepare. Add icons, diagrams, and MS Office data charts.
- Reuse existing infographics templates, which is faster and handier.
Peter and Anastasia at infoDiagram
One last question: is there something you miss in the template – timeline, table, or sales funnel?


