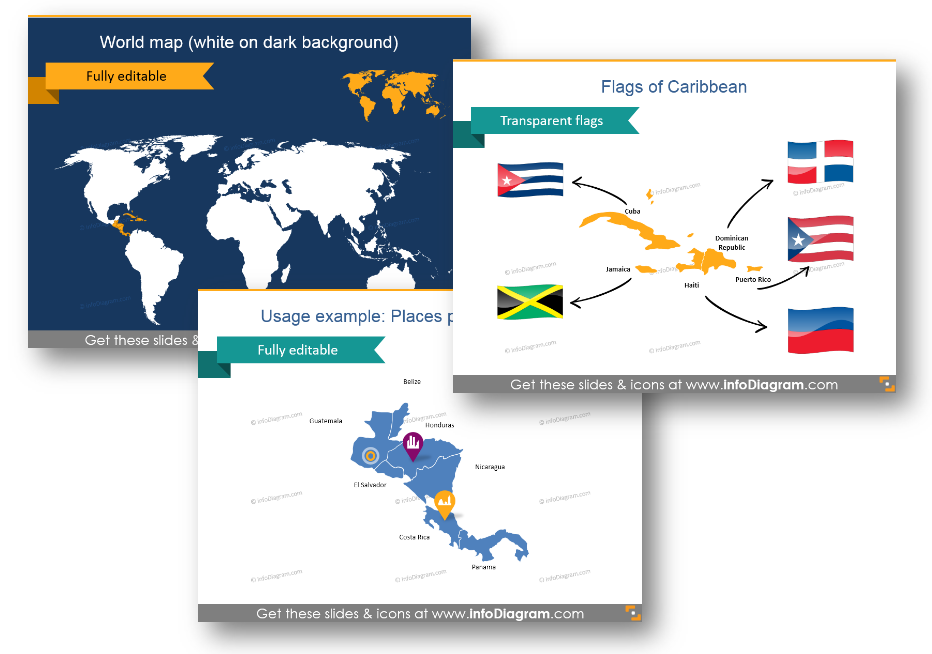
Central America Countries: Best Ways to Present Maps Creatively
Having logistics or a supply chain presentation? In this blog, we propose examples of using Central America countries or Caribbean maps to illustrate a sales report, marketing, or business reviews. Use them as an inspiration :).
Remark: you can get all the icons and slides in Central America & Caribbean Maps Collection.
If you are about to show Costa Rica’s capital, the famous Panama supply chain bottleneck, your travel destinations in Cuba or Haiti, or an economic snapshot of the Dominican Republic, adding a map to the slide is the best way to visualize your message.
With a few location icons and hand-drawn arrows, you can creatively show routes from point A to point B and C in Central America, create transportation routes and show flights and trains between the countries, and make a map with production and distribution centers.
Why use the Central America countries maps set?
Some common problems you can face while searching for various maps are:
- It is complicated to find a whole blank map or pull a particular state out of it (especially for Central American countries)
- The inconsistent look of slides if you use several resources
- Unclear legal rights for using the graphics from the Internet search
- Pictures may not be editable in PowerPoint
- The low visual quality of images
With our infoDiagram Central America & Caribbean Maps collection, we address all those issues. Check the pictures below/
Usage Examples of Applying Editable Maps and Icons
There are dozens of slides where you can apply maps for better visualization. Here are a few kinds of them, where we used maps together with some icons.
Illustrate the Whole Region with Flags
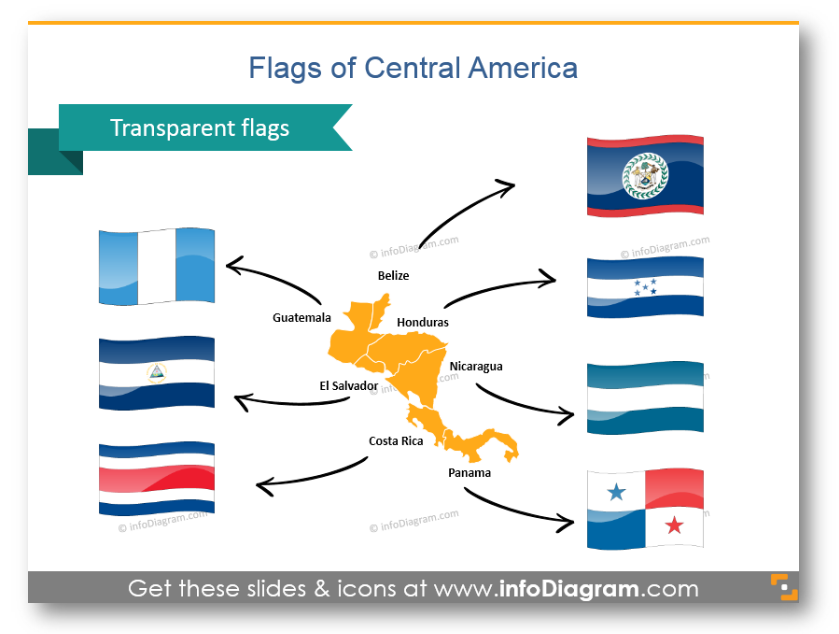
Talking about existing or new sales points or offices? Illustrate your map with flags – that’s how it will become more lively and easier to catch. In the slide example above you can see the Central America countries, illustrated with flags: Guatemala, Belize, Honduras, El Salvador, Costa Rica, Nicaragua, and Panama.
Show Transportation Routes or Paths
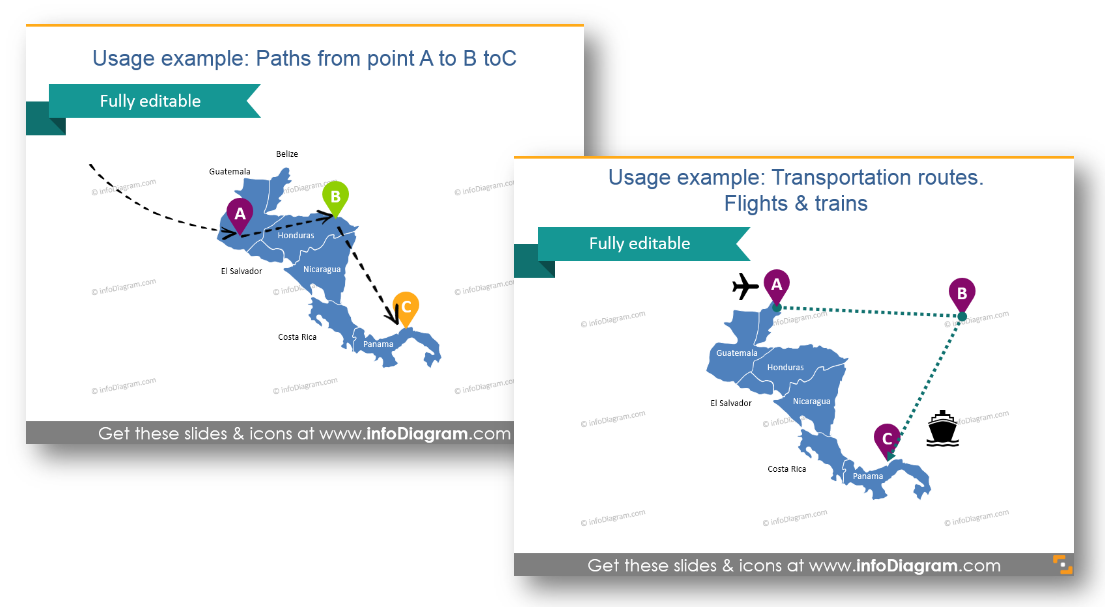
With such flat symbols and arrows, it is easy to design a compelling map slide. You can also put pins or flags in different colors to show common characteristics or differences between cities or states.
Put Distribution and Production Centers on the Map
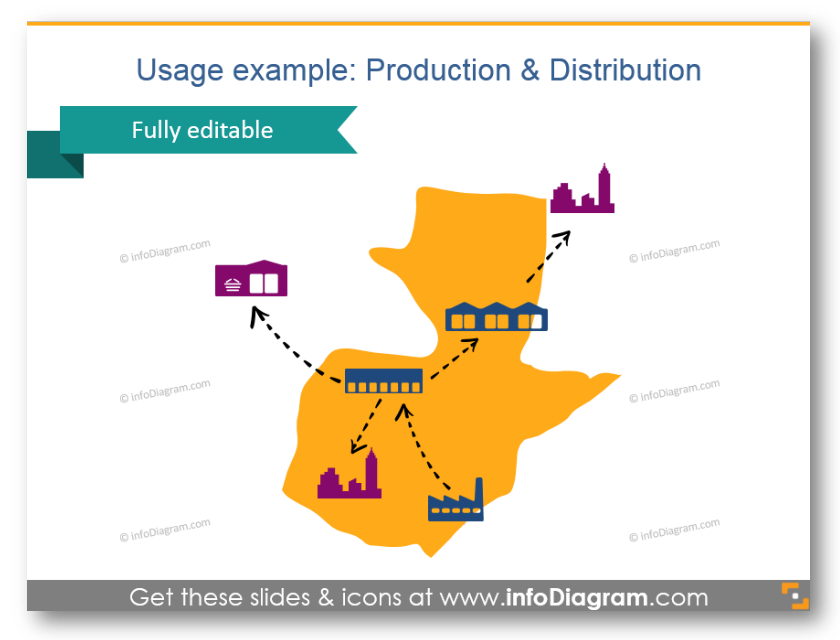
We also added sets of production, distribution, wholesale and retail icons to help you take steps into a world of visualizations. You can add arrows as well to show relations between points, like in the picture, where distribution and production centers are shown on the Guatemala map.
Present Country Statistics
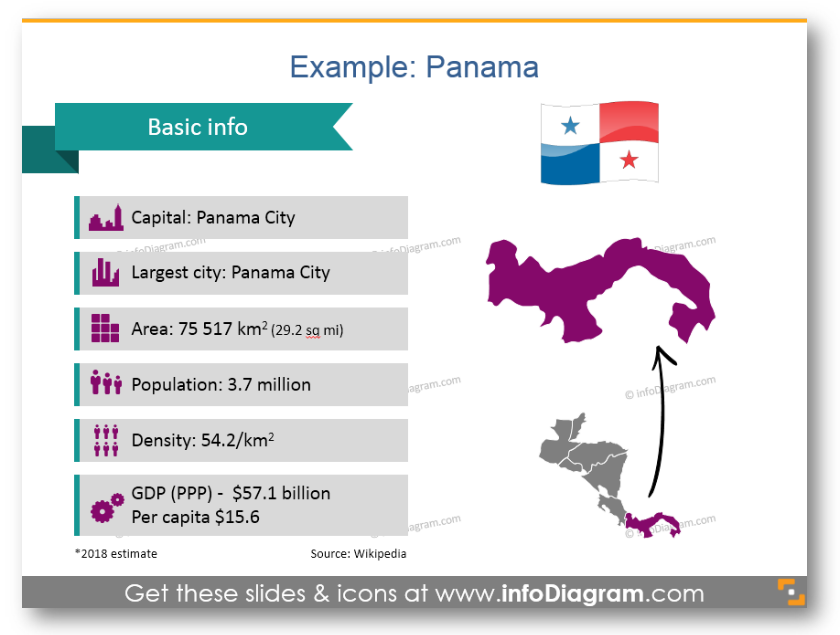
Present different country indexes (like we did on the usage example with using Panama map): area, population, density, GDP. They look much better in such a way, don’t they? 🙂
Maps are a great visual tool to use in PowerPoint or any other presentation type (by the way, map graphics can be exported and used in other applications – like in this blog, inside Word, Prezi, and Keynote). They engage the reader much more than a plain text description. You can use the article as an inspiration or apply pre-designed map slides. All usage examples from this blog are available in editable form here.
For more map presentation ideas, take a look at our other article: Four ideas on how you can create a good-looking map slide.
What’s inside the Central America & Caribbean PPT maps set?
The collection contains flat symbols which are all presented as editable vector artwork so you can adjust them as needed. They remain razor-sharp also if you resize them, unlike bitmap pictures. You can choose colors to correspond with your brand, the color scheme, and the layout of your presentation, or create natural-looking icons with numerous colors.
The map and icon collection consists of:
- Examples of maps illustrations:
- Country statistics data: Population, Density, Area, GDP, Largest city, Capital
- World map with Central America highlighted
- Icons for showing localization and logistics on maps:
- Pins and flags for indicating a place
- Hand-drawn arrows for showing routes and journeys
- Transportation icons: Truck, Train, Plane, Ship, Bus, and Lorry for illustrating logistic routes on the America map
- Production pictograms: Factory icon, Production facility icon, Production gears icon
- Distribution pictograms: Distribution center icon, Wholesale icon, Consumption Retail shop icon
- City pictogram: Capital icon, a Big city icon
- Examples of PowerPoint maps visualization:
- Routes from point A to point B and C in Central America
- Transportation routes: flights and trains between the countries
- Production and distribution routes from the factory to distribution centers and retail shops
Here’s the list of countries, which flags you can find in the collection:
- Belize
- Costa Rica
- El Salvador
- Guatemala
- Honduras
- Nicaragua
- Panama
- The Bahamas
- Cuba
- Haiti
- The Dominican Republic
- Puerto Rico
- Jamaica
All map templates and icons above are from our infoDiagram PowerPoint Diagrams collection. It contains localization and logistics symbols and middle American maps, which can be easily edited and added to other presentations.
If you want to get more maps – check this Bundle of World Maps PPT Template – with over 200 editable PowerPoint maps of continents and countries. It also includes Central America Map graphics presented above.


