Using 3D Supply Chain Vector Icons for Realistic PPT Illustrations
Why use 3D icons in a presentation?
3D logistics icons are useful for creating realistic presentation flowcharts. These so-called isometric icons allow you to present various logistical processes close to a real three-dimensional view of objects from above. If you’ve seen our posts about flat icons (Simple Flat Icons for Infographics Presentation), you’re familiar with the way imagery can help you explain logistics. You may also be wondering what makes a 3D icon better than a 2D icon, or whether there is a difference at all.
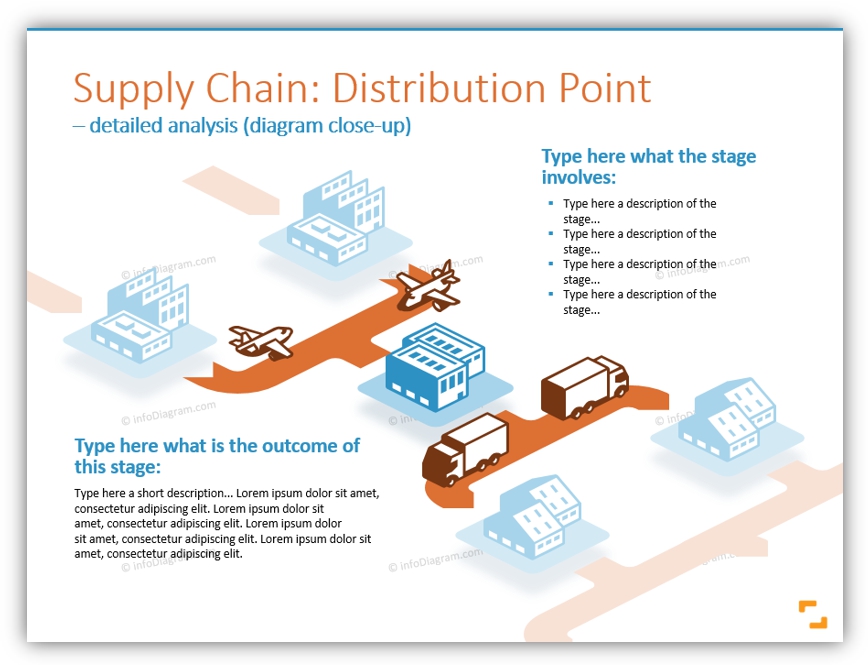
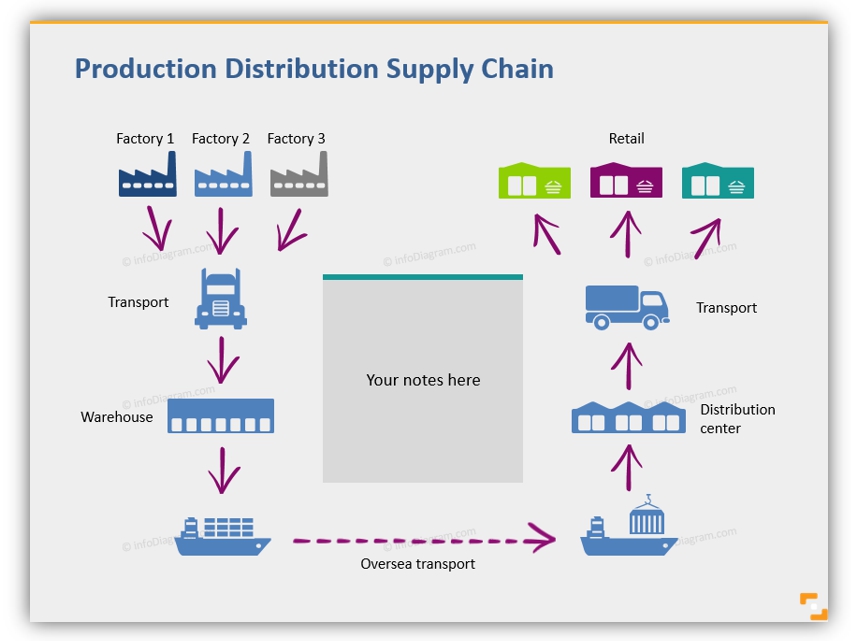
Look at the difference. We have found that 3D diagrams look more sophisticated. This aids credibility and professionalism across the board. Regardless of what the setting is, you can never look too capable and prepared.
Remark: You can get all the diagrams and icons from 3D Supply Chain Vector Icons set.
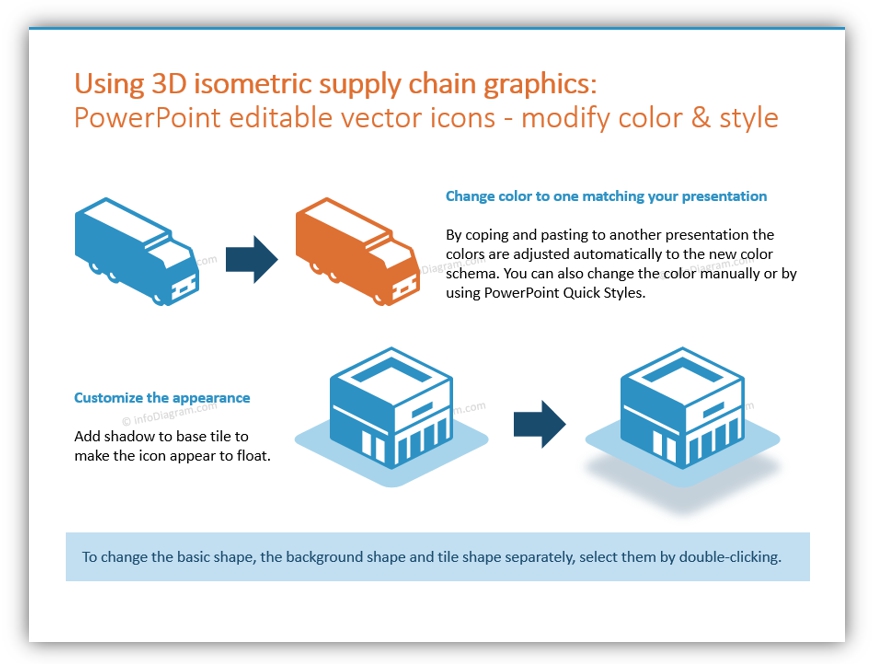
Similar to 2D icons and our other image sets, 3D icons can be customized. You can change their colors, size, and style. This will help you be sure all of the images used in your presentation match. They should match one another, as well as your business.
How can you use 3D logistical icons?
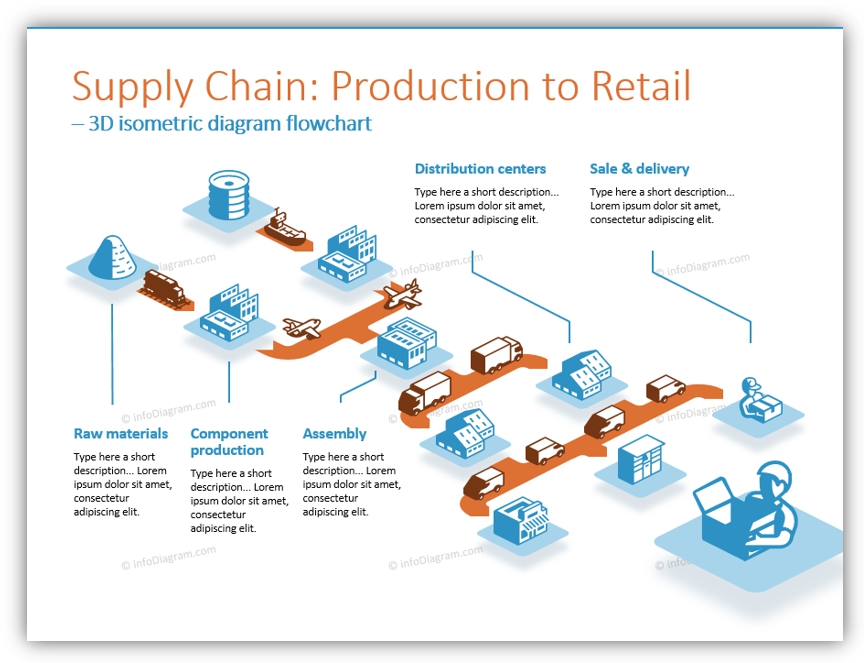
One of the many uses for 3D logistical icons, regardless of the colors you choose, is to help your audience visualize the supply chain. You can easily explain the supply chain for a variety of purposes. One purpose is to help those who are part of the process, from procurement to production, see what role they play. Another purpose is to help those in customer service better understand the steps between a customer placing an order and the product being manufactured and sent. Management can also get a better perspective on how different departments should be working together. This will help them better facilitate the delivery of products to the end customer. Service management needs can also be met through presentations. They can help manage the repair process from customer service calls and spare part deliveries to sending on-site technicians.
Making e-commerce infographics with PowerPoint and 3D icons
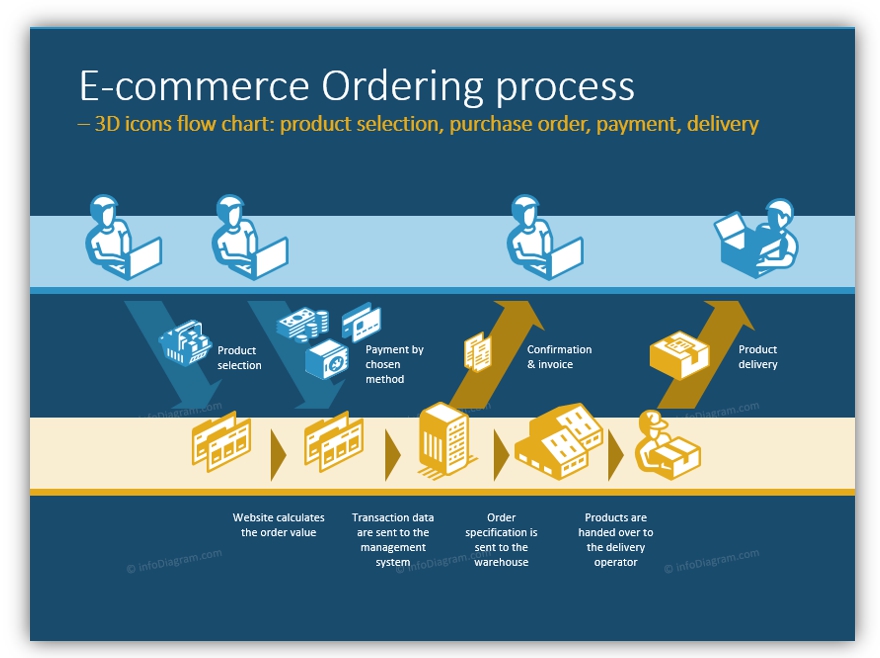
Icons can be used to break down your e-commerce process. They can help you evaluate flaws and breakdowns in the process. An easy way to highlight where the current process falls short is to explain idealized versions of the process from production to retail.
Be aware, flow charts with 3D icons do require some additional effort. The set comes with an isometric grid to make creating 3D diagrams and flowcharts easier. Data charts can also be created with 3D icons. Regardless of which style of chart you wish to create, straight corners, forks, and other supplemental shapes can make that easier.
What kind of charts can you build with 3D icons?
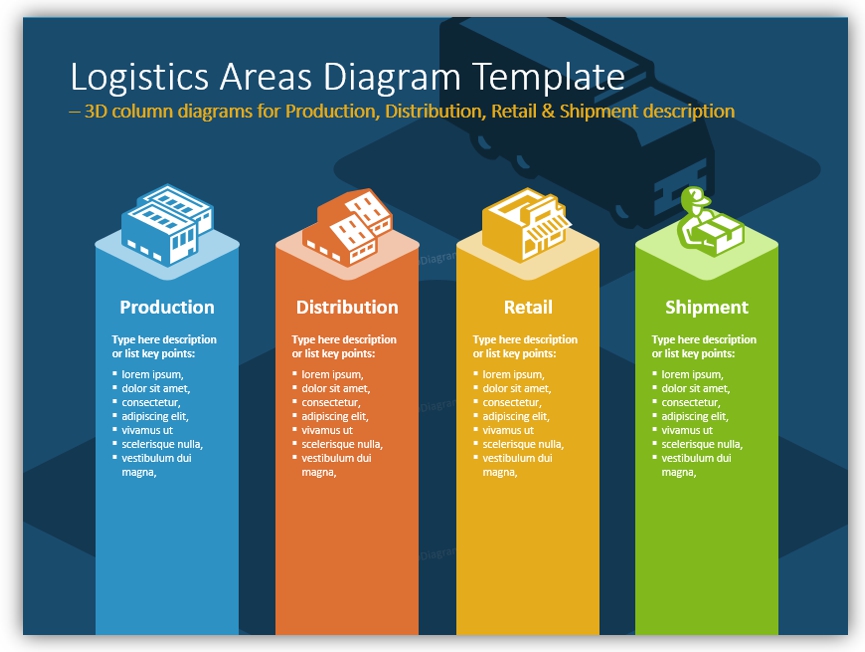
You can enhance standard Office data charts illustrating its legend with 3D icons, or incorporate them into the bar chart as we did in the picture above.
The corners may be stacked as pictured to represent the percentage of orders delivered via a particular method or to represent any other data. You may easily tweak the images to match your intended purpose by changing the color and other attributes to suit your needs.
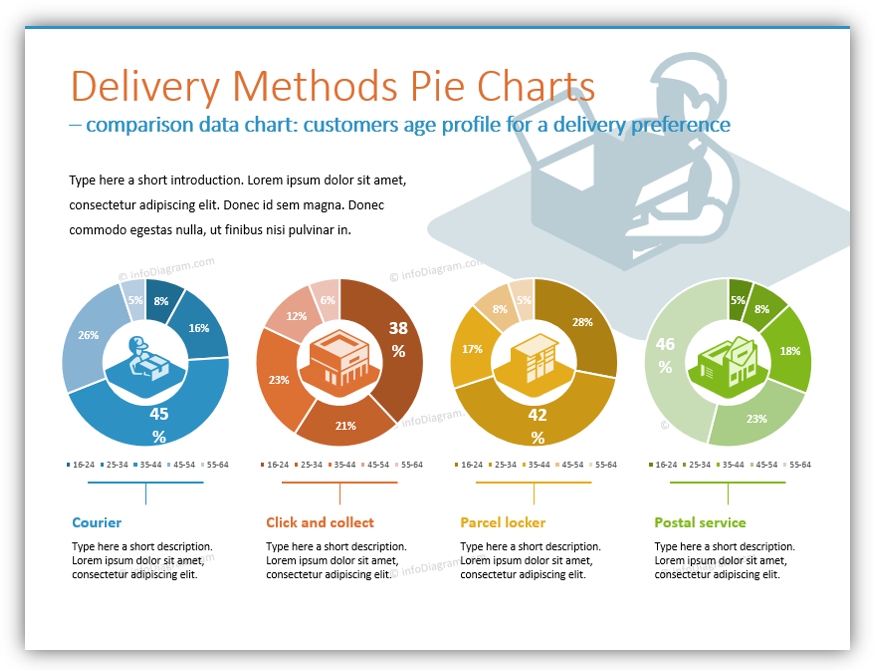
If you generate multiple pie charts, as shown above, you may show more detailed information. In this example, we show demographic information about customers who requested delivery via a particular method. However, you could easily use this method to display different information.
Create impressive presentations with realistic 3D symbols
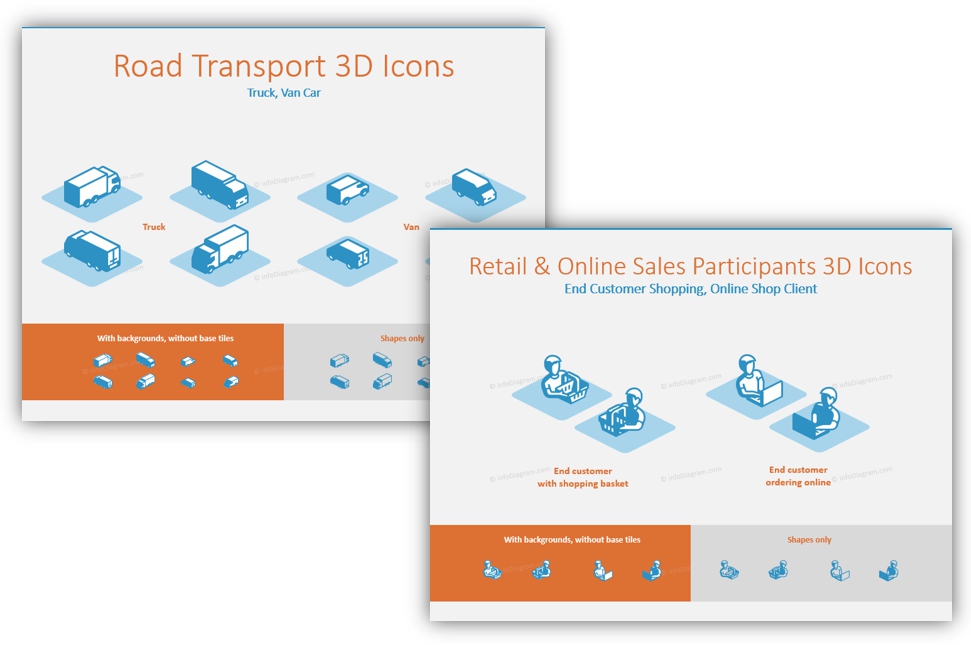
Whether you are presenting information about retail and online sales or different methods of road transport, there are 3D logistical icons to suit your purpose.
If you need graphics to represent your distribution methods and process, check our collection of 3D icons covering supply chain topics such as manufacturing, logistics management, transport means, and retail.
Not sure how to best represent your ideas? Reach out to us. We’d love to hear from you and help.


