Use PowerPoint to Make a Stylized Process Flowchart
What is a flowchart? How might a flowchart benefit your presentations?
A flowchart is a diagram you can use to represent an algorithm, workflow, or process.
Flowcharts help make your process, algorithm, or workflow easier for an audience to understand.
If they are not already familiar with what you’re describing, the flowchart will break it down for them. This improves their understanding, and in so doing makes your presentation more effective.
If you need to utilize several flowcharts or don’t have the time to create your own, check out these Creative Process Flow Chart Diagrams.
The set contains numerous flow charts which only need to be customized to meet your needs rather than built from the ground up, which will save you time and ensure uniformity across your presentation. If you’d prefer to build your own, read on!
Why it is important to use Flow Charts
Flow charts use standardized symbols to describe different processes or decisions.
You can utilize different flowchart symbols:
- terminator: indicates the beginning or ending of the flowchart or path.
- process step: represents a set of operations which changes the value, location, or form of the data.
- decision: shows a conditioned operation. It determines which of the paths can be taken.
- input/output: references the process of inputting and outputting data. This can also reference entering data and displaying results.
Want to use these flowchart symbols to build your own? Let’s get started.
Build your process flowchart using shapes
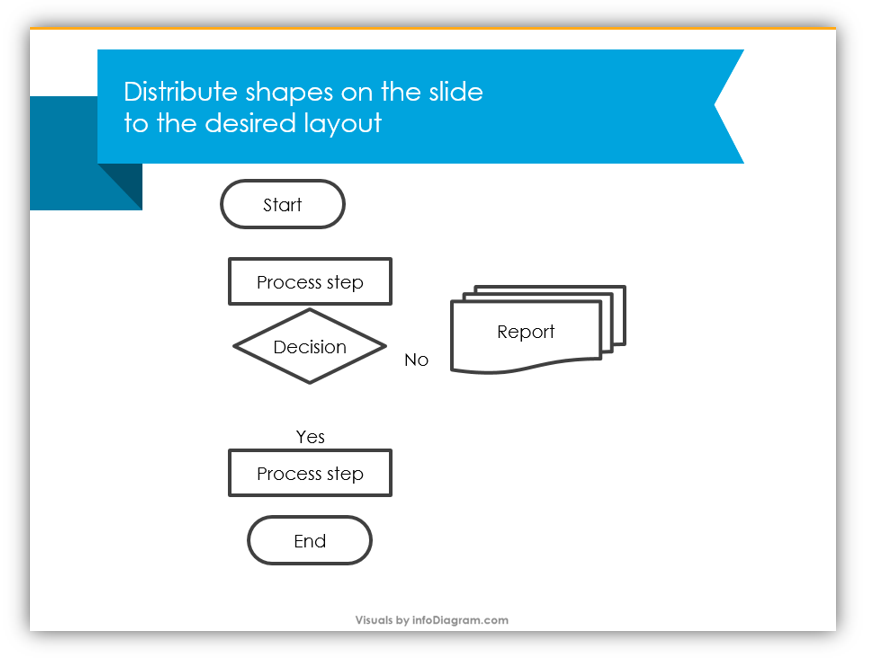
You’ll want to choose shapes to represent each type of flowchart symbol, and arrange them in the layout order you’d like.
Align and distribute the shapes and add color
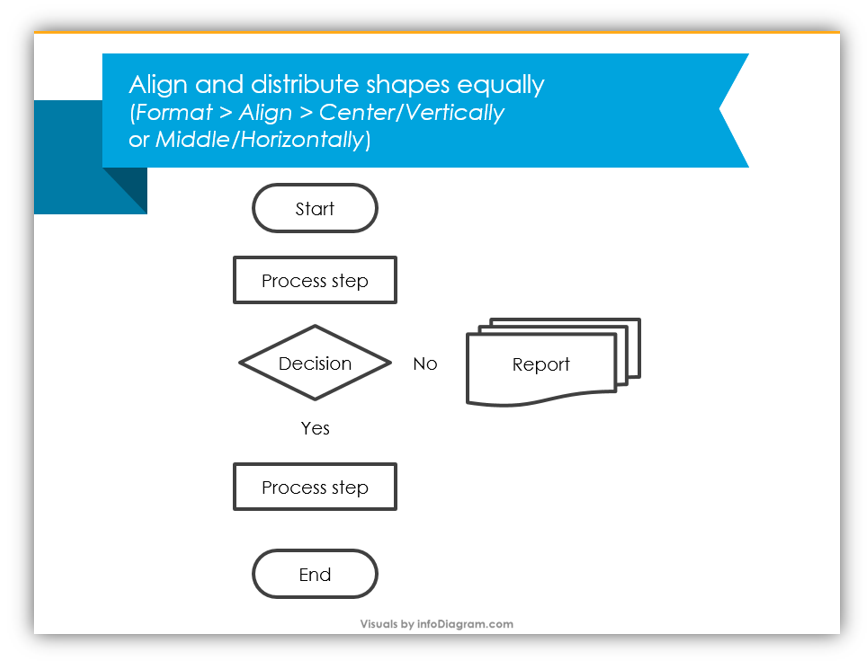
You can align and distribute the shapes you draw equally. Select Format > Align > Center/Vertically OR Middle/Horizontally, however, you’d like the shapes to be aligned. You can also add colors to make your symbols more distinctive. Ideally, you should use the same color for each different symbol type. When adding the color you can ensure visual harmony by making the shape outline the same color as the shape itself, just a bit darker. If you choose dark colors for the shapes, make sure you make the text light so it is legible.
Link Shapes
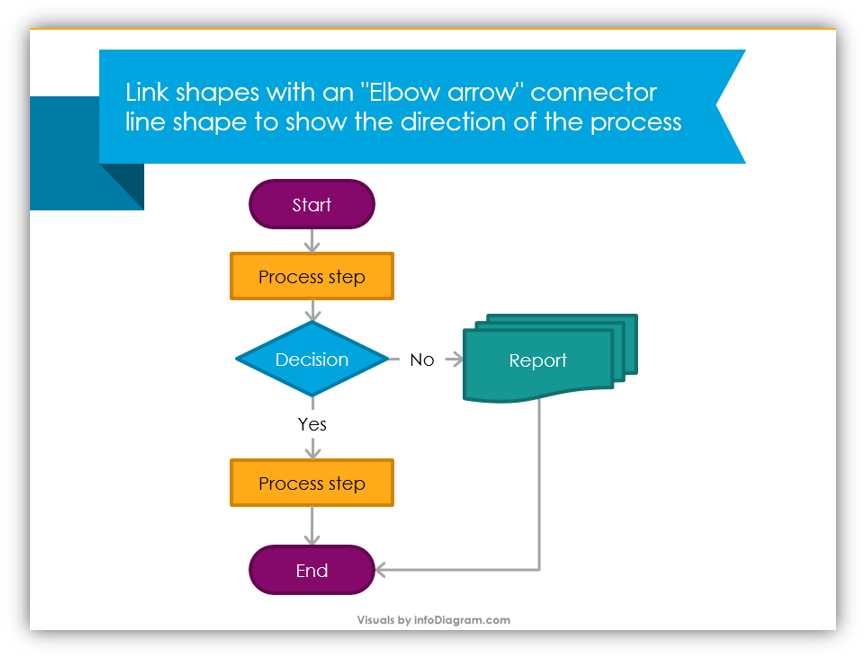
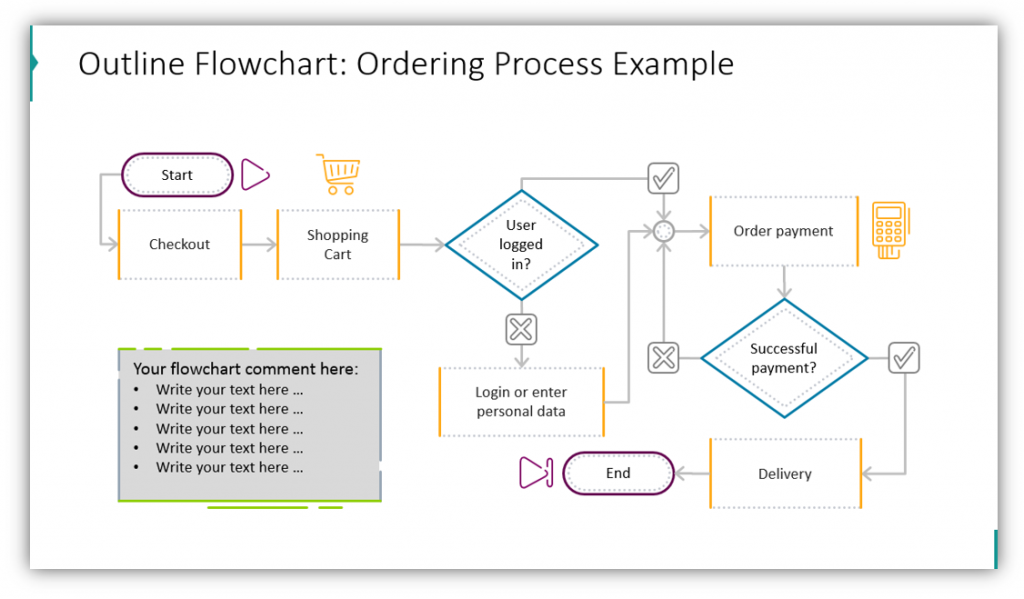
You should link the shapes with an “elbow arrow” connector line shape. This will show your audience the order of the process and the direction the steps flow in. If you want your flowchart to be more visual, you can sub out some of the text with icons or symbols.
Feel free to re-use the templates provided in the Creative Process Flow Chart Diagrams set or make your own based on the tips provided here. If you want to add more image variety you can use symbols from [Related icon sets]. This will help keep your presentation fresh, especially if you need to explain several processes or utilize multiple flow charts. Keep creative flow chart design in mind the next time you need to build a compelling presentation.
Graphical Resources: Creative Process Flowchart Diagrams
To help you explain processes, workflows, and algorithms, we created flow chart diagrams collection:
You can easily create your own stylized process flow charts in PowerPoint, but if you would prefer to save the time and only customize existing flow charts, we’re here to help.


