Present Design Thinking Process with Sleek PowerPoint Diagrams
Do you use the design thinking process in or on behalf of your business? Whether you’re literally developing design concepts with a team or are innovating your offerings with this approach, using impactful visuals will help you make your points.
Explore our Business Performance PPT Reports category on the website for more resources to boost your presentation impact.
Why present design thinking visually?
Having a clear, visual flow chart will help you stay on track and help your audience follow along. They will benefit from simple, easy-to-follow visuals.
Articulate your plans and thoughts clearly and concisely with modern graphics. Make your otherwise busy content look professional with ease. See the full Design Thinking PowerPoint Diagrams set by clicking here.
Look at these examples to see how you can better present design thinking:
Explain the 3 stages of design thinking on one slide
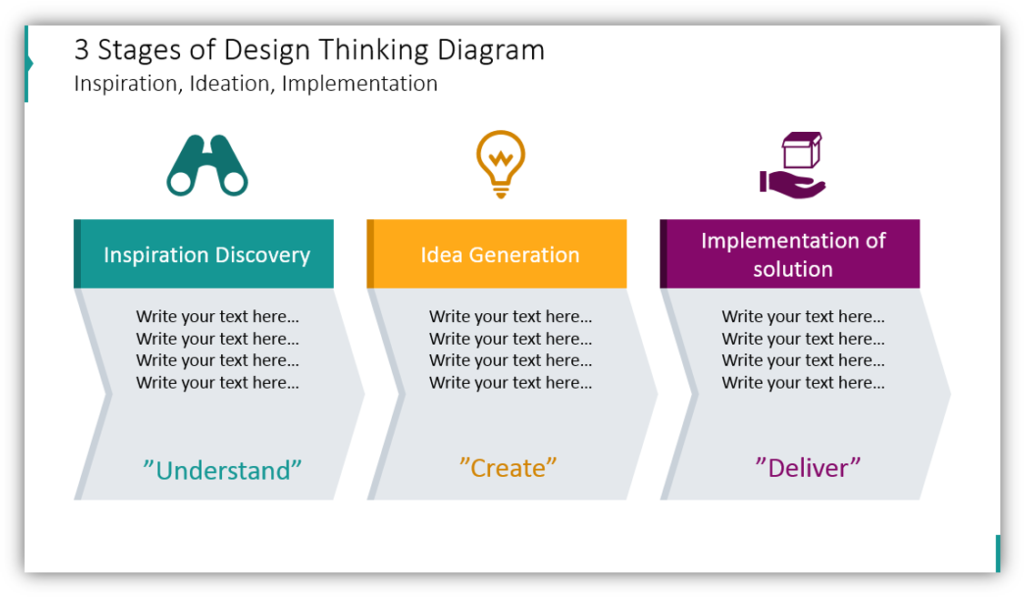
The 3 stages of design thinking are usually inspiration discovery, idea generation, and implementation of the solution you’ve devised. This may not be the case for your process or the scenario you need to present, but this basic framework can set the stage for numerous presentations on virtually any topic.
Present relations among the 5 action phases of design thinking
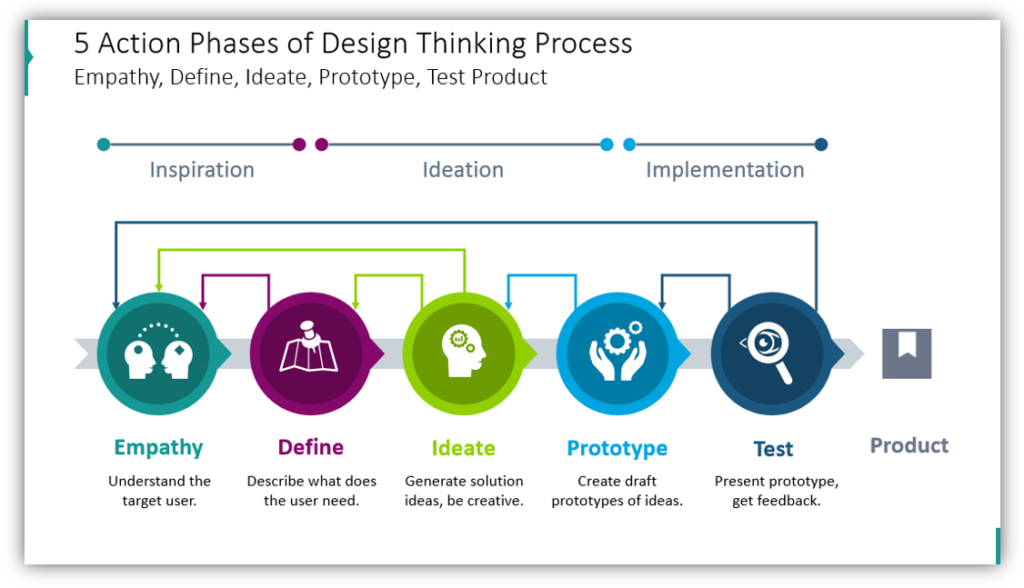
The 3 stages of design thinking can further be divided into 5 action phases. They are empathy – where you understand your target user; define – where you describe what the user needs; ideate – you generate solutions and come up with ideas; prototype – you try to draft prototypes of the creative solutions you devised in the ideation stage; test – the final phase where you present and test your prototype to see what can be improved. Think about what this process would look like in your organization.
You can visualize the flow of these 5 phases with 5 circles. You can make each look distinctive by using various colors and adding icon symbols for each phase. In the example, we used two people sharing the ideas for the empathy phase and a magnifying glass for the testing phase. We added arrows to show each iteration of feedback loops among the elements.
Describe the details of each phase in separate slides
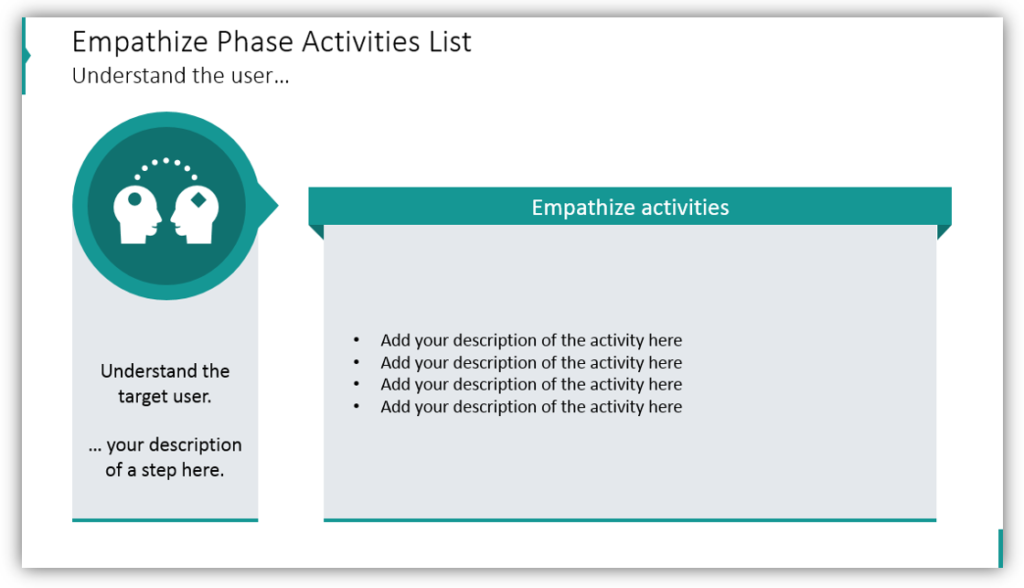
In the example, the Empathy action phase has been selected. The description of what understanding the target user looks like for you and your organization can be changed. You can add the steps which are part of this phase in the larger box. Avoid boring text-only slides and repetition while maintaining visual consistency. Achieve this by keeping the visuals cohesive and appealing. We used one main color variation for each slide with a specific phase. In the example, you see we used light and dark turquoise for Empathy.
Present non-linear looping processes of the flow
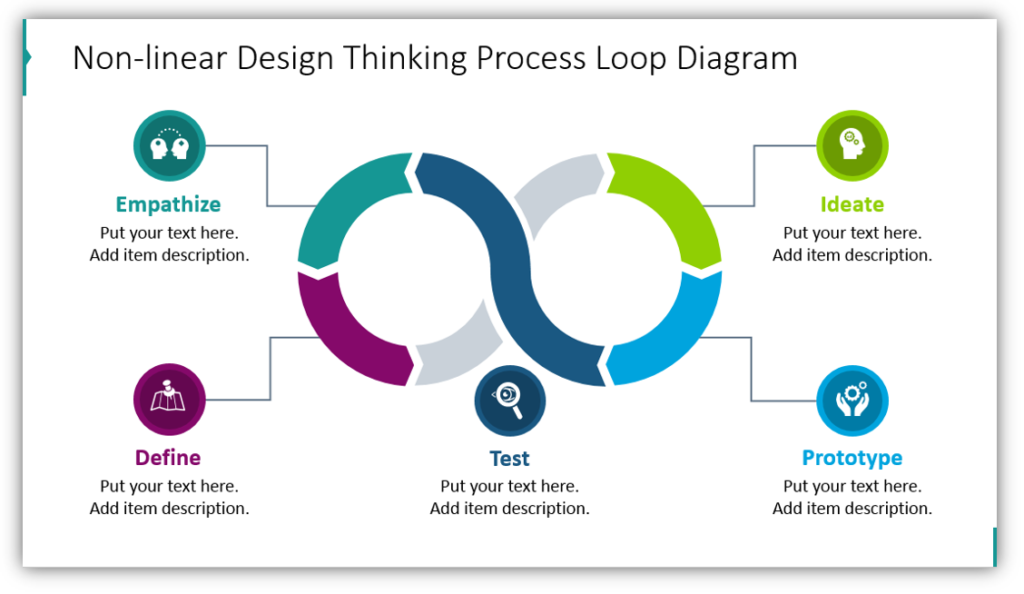
What if your design thinking process isn’t linear? That’s fine! You can use loop diagrams to present these same steps in a striking, modern way. Let your audience see how the different phases interact and lead into one another. This approach is creative and eye-catching and using this diagram along with the linear structure may grant your audience an alternate perspective and help those who struggle with the concepts to understand.
Express diverging and converging ideation process with a double diamond diagram
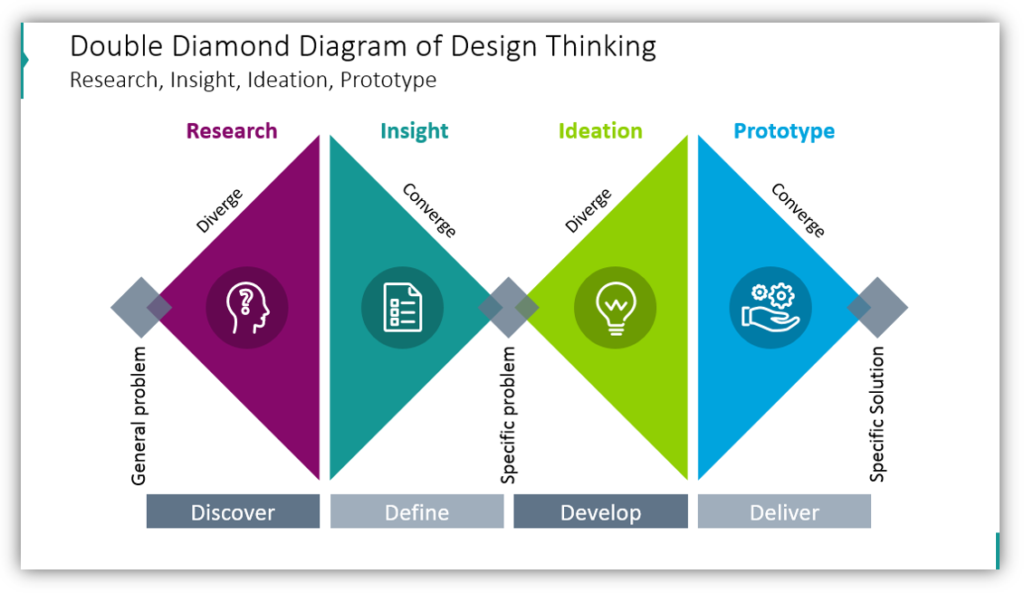
The Double Diamond Diagram of Design Thinking is a unique way to break down a process into the research, insight, ideation, and prototype phases.
We additionally illustrated the four key diamond elements with outline icons: Discovery with the outline of the silhouette of a man’s head with a question mark, defining with a list on a piece of paper, develop with a lightbulb outline, and deliver with the outline of a hand beneath two gear outlines. You might proceed differently when you have a general problem versus a specific problem and this diagram will help you explain that to your audience.
Using diagrams to keep your design thinking presentation fresh
Explaining design thinking yourself without images can be difficult and confusing. Creating dynamic graphics can be time-consuming, and they may not be as visually appealing when you build your own.
For more inspiration, subscribe to our YouTube channel:
Resource: Design Thinking Process Diagrams
We created the Design Thinking Process Diagrams set to help you overcome the challenges which stand between you and a compelling presentation. Avoid repetitive presentations with fresh, clean graphics. This set really POPs, which will help your audience stay interested and follow along:
With graphics, you can often communicate a full idea, so why not put that to work for your next presentation? Give an impactful presentation without building all the graphics yourself. To make your presentations even greater, consider adding diagrams and chart graphics to your slides.


