How to Illustrate Risk Levels Effectively in PowerPoint
Need to present risk or reward analysis for your business? A great way to show the various levels of risk is through visualization forming a pyramid. Risk pyramid visuals will help your audience understand the risk profile assessment or risk mitigation approach.
Explore our Business Performance PPT Reports category on the website for more resources to boost your presentation impact.
A pyramid with horizontal layers is the visualization metaphor expressing a hierarchy of certain parameter. It can be used for investment or business risk illustration and gives investors or shareholders a good insight into assets or risk factors portfolio. Such diagram will help you to successfully explain various risk levels and the potential rewards to be gained.
We created the Investment Risk Pyramids Presentation PowerPoint graphics set to help you design visually appealing slides and save time. Check out the full template set to inspire your next presentation.
Check our five examples of how you can use risk pyramid graphics in your presentation. In the end, you’ll find a practical step-by-step guide on how to visualize risk levels of investors’ portfolios.
Define financial investment risk levels
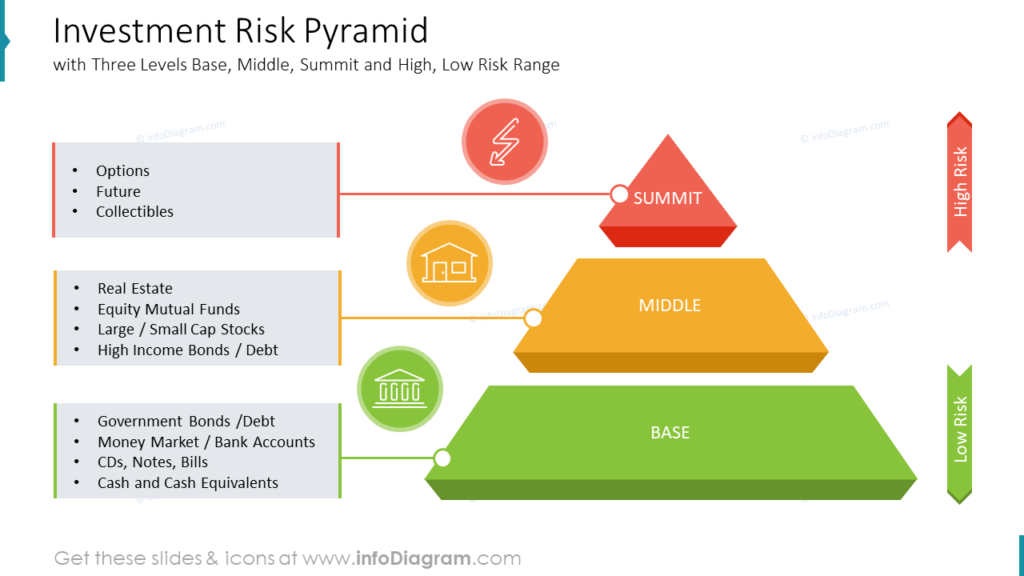
You can illustrate low and high-risk ranges using three blocks of various colors for the base, middle and summit levels. In the example above you can see how the color coding is used also for notes aside. Besides colors, the icons additionally illustrate the three layers of base low financial risk, middle level and summit associated usually with high risk – therefore we used the red color there.
Show factors influencing a business risk
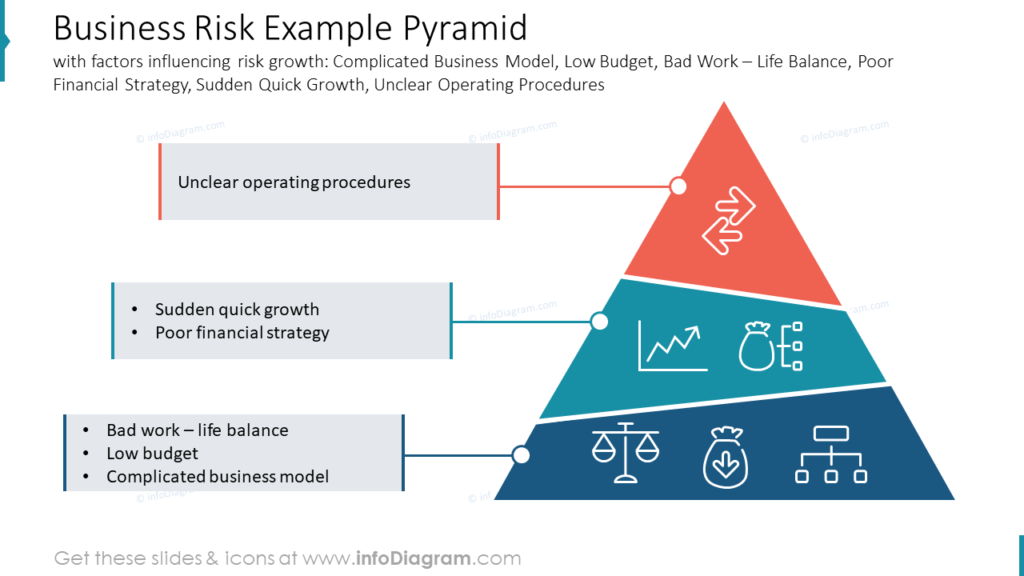
This is a bit more creative illustration business risk pyramid example, with factors influencing risk growth: Complicated Business Model, Low Budget, Bad Work-Life Balance, Poor Financial Strategy, Sudden Quick Growth, and Unclear Operating Procedures. You can show three risk levels with different colors and icons.
Present Risk – Reward dependencies
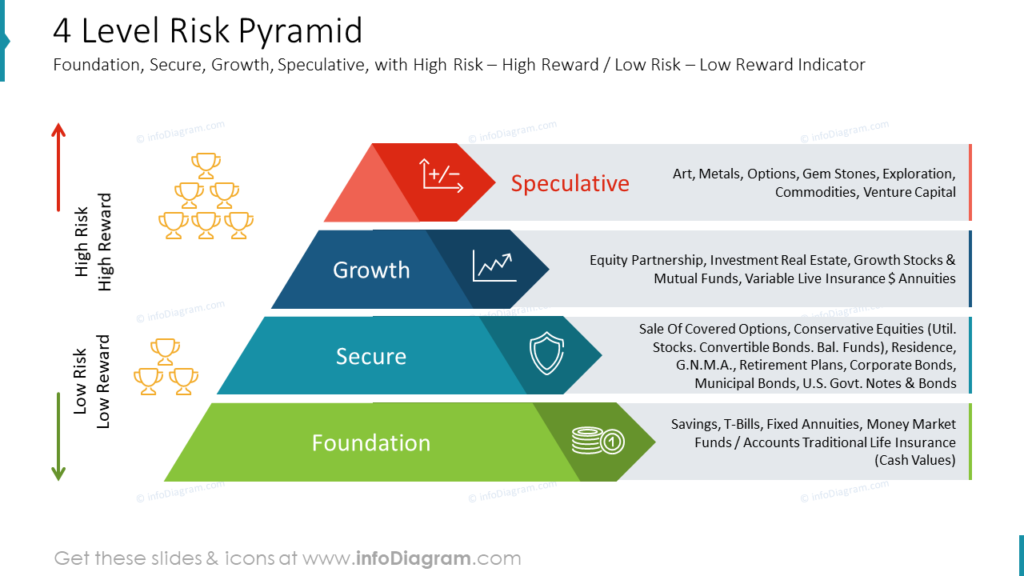
If you need to show four levels of risk, have a look at this illustration, which aimed to show Foundation, Secure, Growth, and Speculative levels, with High Risk – High Reward and Low Risk – Low Reward Indicators.
Illustrate Risk Hazard control by reverted pyramid diagram
Sometimes all we need to do is to look at things from a different perspective. To show the hierarchy of risk hazard control, you can use a reverted pyramid with typical 5 levels of control used e.g. in the manufacturing environment:
- Elimination – physically removing the hazard
- Substitution – replacing the hazard
- Engineering Controls – isolating people from the hazard
- Administrative Controls – changing the way people work
- PPE level – protecting workers with Personal Protective Equipment
As you can see in the slide visualization, we included a short description and a symbol for each level, associated with proper color coding and icon symbols.
Illustrate risk tools with 3D pyramid graphics
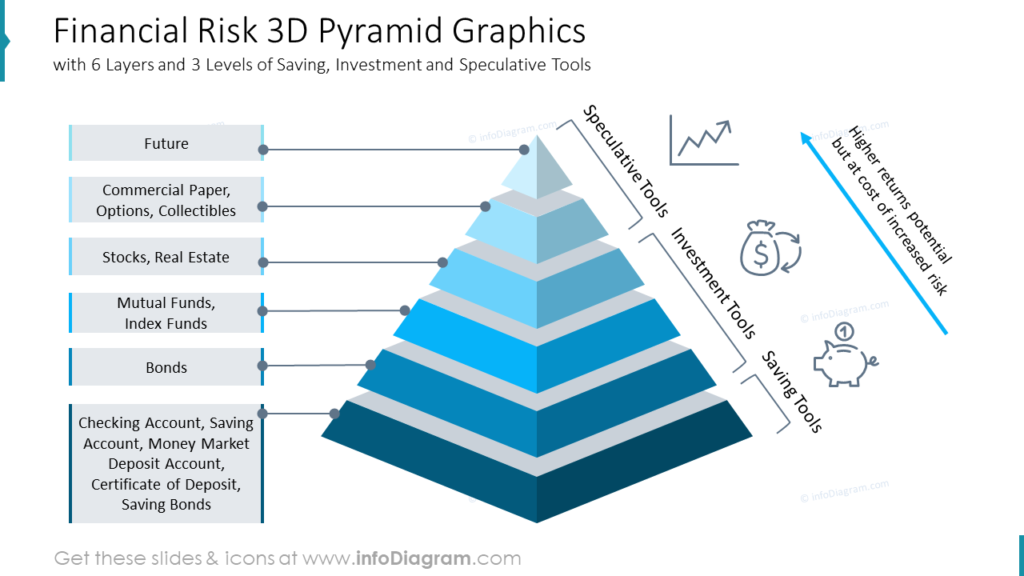
If you’re looking for a bit more elaborate way of presenting financial risks, you can consider using the 3D effect on the slide. On the slide above, the financial risk pyramid, including 6 layers and 3 levels of saving investment, and speculative tools, is shown with such a 3D effect.
Guide on how to design a risk levels infographic
Check out our step-by-step instructions on how you can present risk levels of investors’ portfolios, including safe foundation, security, income generation, growth opportunities, and speculation.
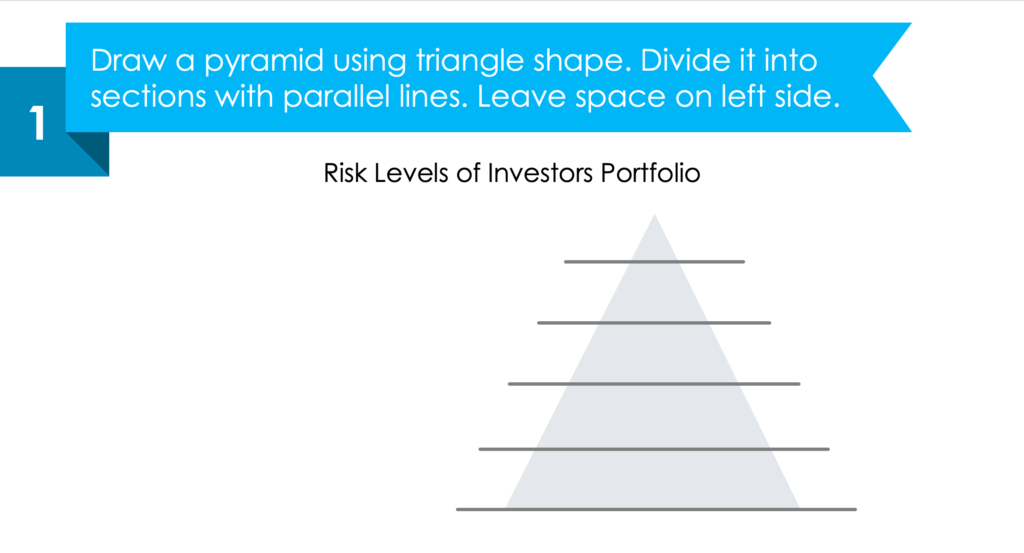
1. Draw a pyramid using a triangle shape.
Divide further the triangle into sections with simple parallel lines. Leave space on left side.
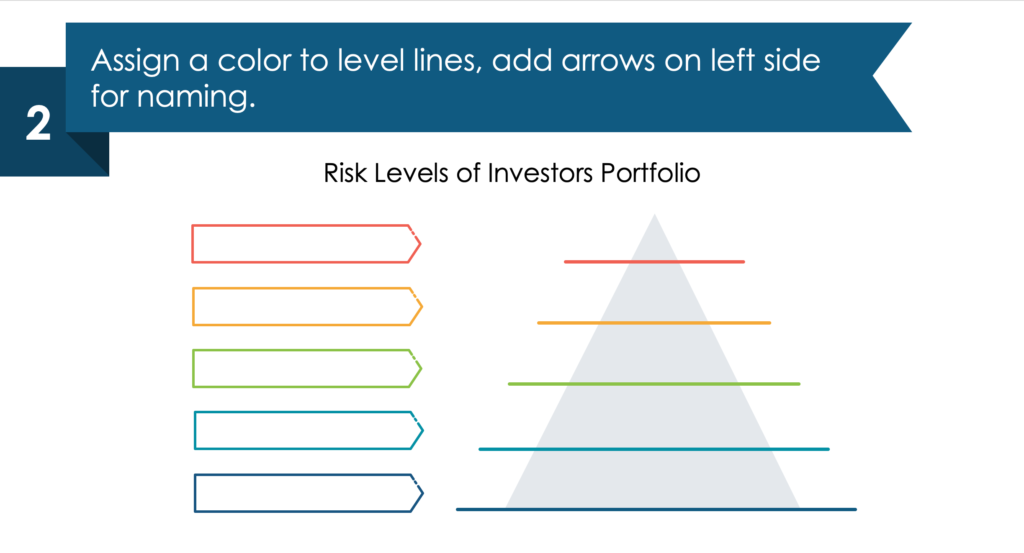
2. Add arrows on the left side for naming.
Assign a color to level lines expressing various risk levels.
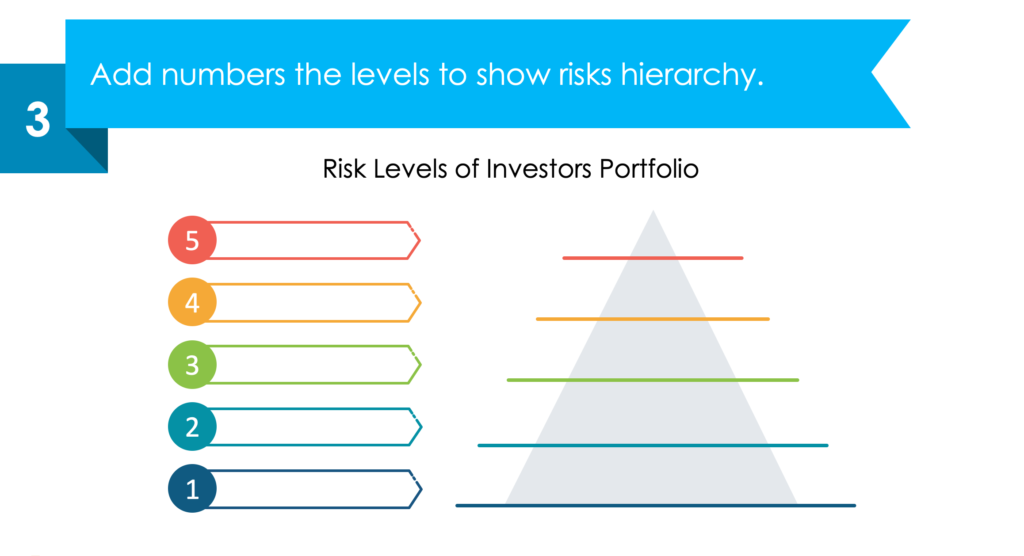
3. Include numbers to the levels to express risks hierarchy.
4. Add naming and explanation text to your risk pyramid diagram.
The text can be put inside arrows and risk pyramid shape. Ensure it’s not stucked too much, keep some white space for better readability.

For more inspiration, subscribe to our YouTube channel:
Resource: Investment Risk Pyramid Presentation Graphics
The examples above are a part of our risk pyramid diagrams collection. You can reuse our infographics and tailor them to your needs to upgrade your presentation slides. The majority of our slides have a space for your text/comments, so it is very easy to extend presented ideas. We also added a general icon collection at the end of the presentation deck. Click on the button to see the full PPT collection:
If you’re looking for other ways to show risk, check our blog about risk matrix and the article on how to show the concept of risk with a symbol for inspirational ideas.
Using concise, modern images will make your presentation easier to understand. To make your presentations even more appealing, consider also using this collection of professionally designed diagram templates.


