Risk Matrix PowerPoint Template: 5 Visual Examples for Presentations
Visualize risk assessment with 5 risk matrix PowerPoint examples. See probability-impact diagrams, heat maps, and editable templates for risk management presentations.
One way to perform and document a risk analysis and assessment is using the risk matrix diagram. This simple visualization matrix is a management method that helps you present possible risks, and define the risk levels. As a result, you can support management decision-making and plan activities to mitigate those risks.
Explore our Business Performance PPT Reports category on the website for more resources to boost your presentation impact.
If you don’t invest in risk management, it doesn’t matter what business you’re in, it’s a risky business.
Gary Cohn
Risk Matrix analysis can be easily visualized in a PowerPoint presentation. Your presentation will look more creative if you use a consistent and clear risk matrix diagram for visualization of the new company’s competitors or changes in government policy.
Remark: You can get all presented icons and slide examples in the Risk Matrix Diagram PPT set.
This visual framework is part of other management strategy tools such as SWOT, Porter Forces, and PEST. You may check this article “7 Visual Frameworks for Strategy Analysis Presentation” for more examples.
Why use a Risk Matrix?
The purpose of risk management is to anticipate and control risks so as to minimize their threats and maximize their potential. The risk matrix diagram will help you to create a memorable presentation of those risks. Using a diagram illustration you can visualize with colors all risk categories and focus attention on the main subject. Risk Matrix graphics can be handy presenters who need to show risk assessment or different states of consequence process.
In this blog, we propose examples of creating and presenting risk matrix diagrams, which will help you to make the possible risks visible.
You’ll find a few variations of showing the Risk Matrix Diagram on the slide:
- showing risk types in the form of a list
- illustrating levels of probability and impact
- presenting probability and severity risk levels
- creating a risk matrix with a place for notes
Let’s start our journey over the Risk Matrix Diagram illustrations examples. See how you can show it creatively so that your audience will be focused on your presentation.
#1: Presenting Types of Risk with Creative Bullet Points
In the beginning, you may want to introduce types of risk:
- Economic risk
- Social risk
- Risk related to the use of various technological advancements
- Risk related to natural forces, so unpredictable sometimes
- Political risks covering country leaders’ actions, various lobbying on a government level, federal agencies regulations, etc.
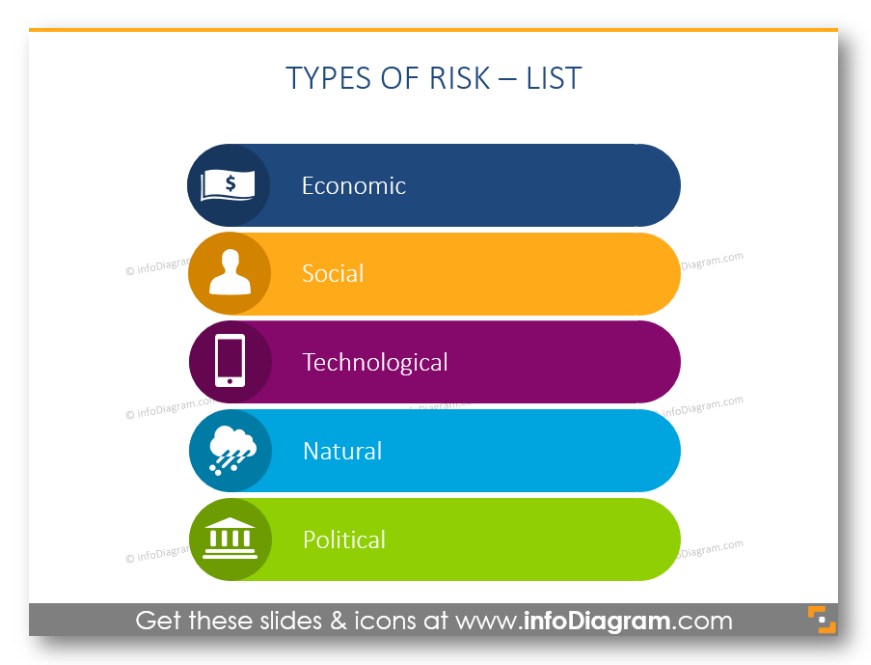
But instead of putting those risks as a standard bullet point list, consider the example below:
The first and easiest way to show various types of risk – use a simple list. This diagram includes all kinds of risks, illustrated with icons and colors. The icons for each stage will help your listeners to focus their attention on one or another point.
#2: Illustrating Risk Probability and Impact
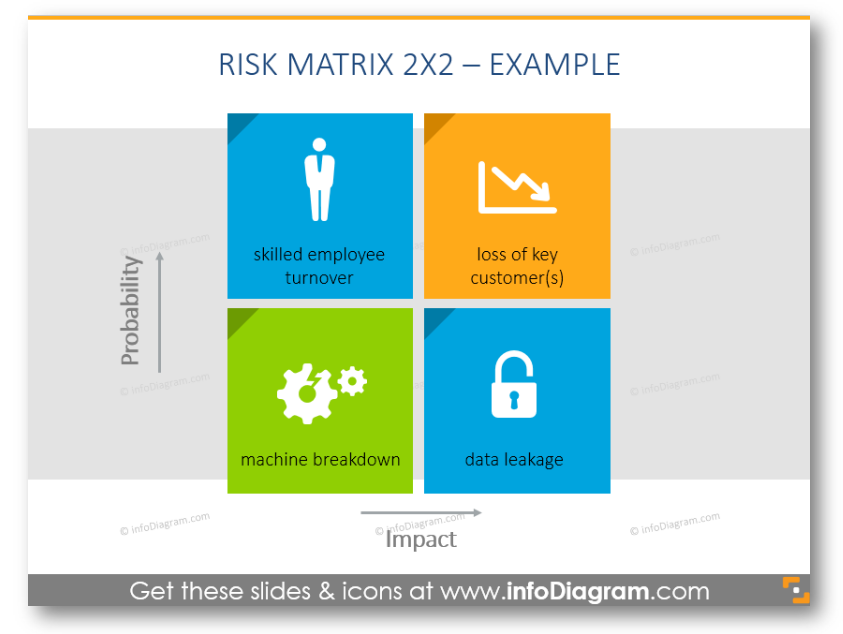
The next example is a typical risk matrix diagram, consisting of 4 parts. Each of them includes an eye-catching icon, therefore it can be employed for any audience: starting from students to your business partners.
#3: Adding Description to Risk Matrix
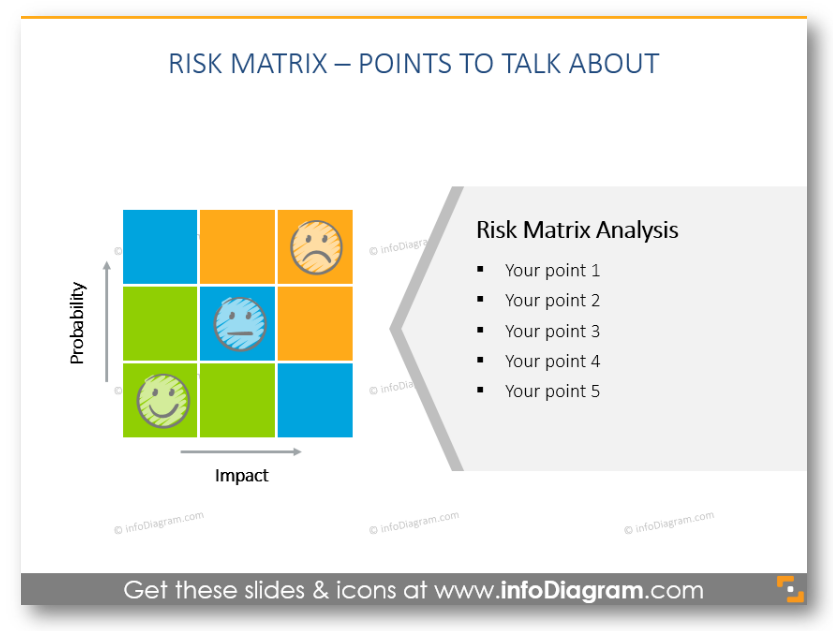
This type of risk matrix slide includes a place for the description of each point of risk. The advantage of this diagram is various symbols that illustrate emotions, so you can easily show risk analysis results.
#4: Showing Risk Probability and Severity Levels
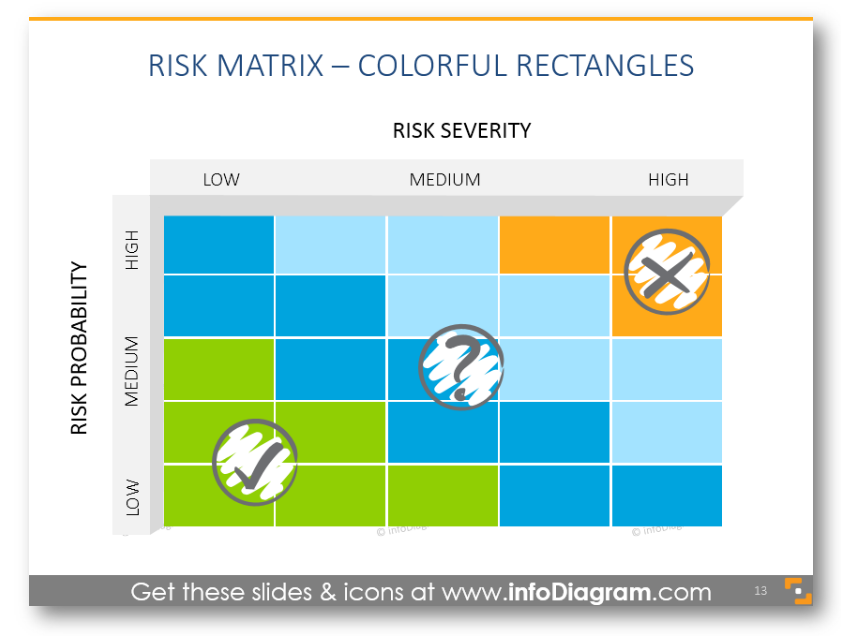
This full-slide risk matrix diagram will help you to conduct a detailed analysis. You can identify your severity and probability risks. A colorful matrix will help you show all levels of risk: low, medium, and high. With such a diagram template, you can easily illustrate the most dangerous risks and keep listeners attention on it.
#5: Creating Risk Matrix in Minimalist Style
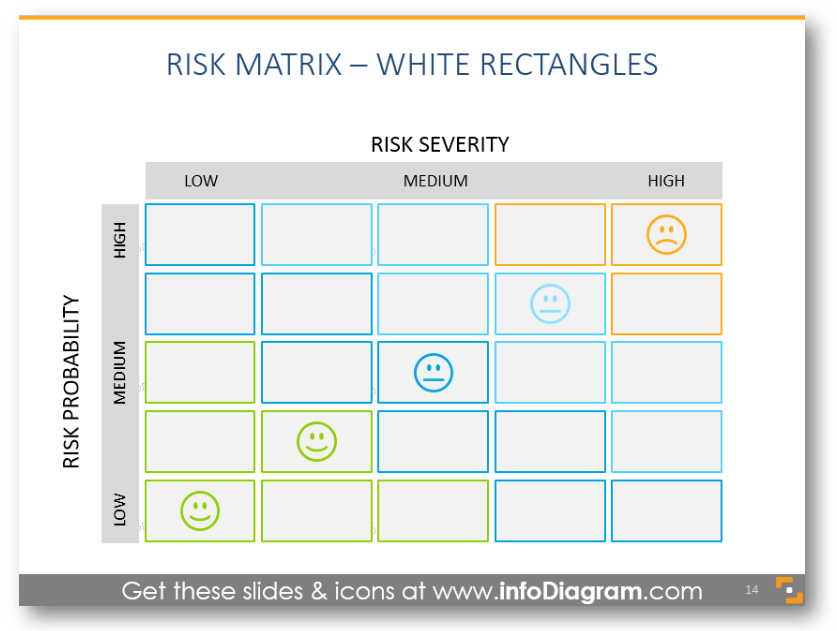
If you like minimalism in your slides, then you can choose such type of risk matrix: white rectangles with colored outlines and simple icons.
Recap of four presented Risk Matrix visualizations
We presented here a bunch of ideas on how you can talk about risk without boring your audience with text-only slides. Get inspired by the examples we mentioned:
- agenda for showing all types of risk
- diagram with a minimalist style with the icons of emotions
- showing risk severity and probability in a big matrix with hand-drawn symbols
- templates for illustrating risk probability and impact
Why use diagrams for the risk matrix concept?
A risk matrix diagram is a simple mechanism to increase the visibility of risks. It is a basic management tool that is useful for strategic planning. Risk provides the objective metric to help the decision-making process. That’s why the risk matrix has been widely adopted by many businesses. The risk matrix diagram focuses on the highest-priority risks and presents complex risk data in a visual chart.
What’s inside the Risk Matrix Template collection?
We created a collection of risk matrix diagrams in various versions and added iconic symbols for 5 types of risk. All icons are fully editable, so you can change their color and resize them without losing the image quality.
The slide set contains:
13 Matrix PPT Slide Layouts for Two-Dimensional Risk Assessment:
- Explanation of the risk matrix concept.
- Diagrams for 2×2, 3×3, and 5×5 matrices with description areas.
- 30 icons for various 5 types of risk, risk severity, and risk probability levels, in flat and handwritten styles.
All examples above are part of the infoDiagram PowerPoint Diagrams collection. It contains vector graphics that can be easily edited and added to other presentations:
Further reading
- Article: 18 Essential Diagram Types for Information Visualization
- Article and slide examples: Time Management Matrix Diagrams in Presentations
- Explore our YouTube channel for more creative ideas for presenting risk topics:
- Or an instruction on visualizing matrix diagrams:


