Euler Diagram vs Venn Diagram: Overlap Examples for PowerPoint Presentations
What is an Euler diagram and how does it differ from a Venn diagram? See examples of overlap diagrams for presentations with editable PowerPoint templates.
Looking for a way to explain relationships between sets or groups? An Euler diagram is a great visual way to present connections among objects by a set of shapes. Check out 5 cases where such a diagram will help you show complex concepts and relations in an easy-to-understand way.
Elevate your business performance presentations with our curated resources – visit our financial performance PPT reports webpage.
Get inspired by the following slide visualizations to help you save time and convey your thoughts in an attractive understandable format.
All slide examples are downloadable, click here to see the full collection of Euler Diagrams of Set Relationship for PowerPoint.
But first, why the Euler diagram?
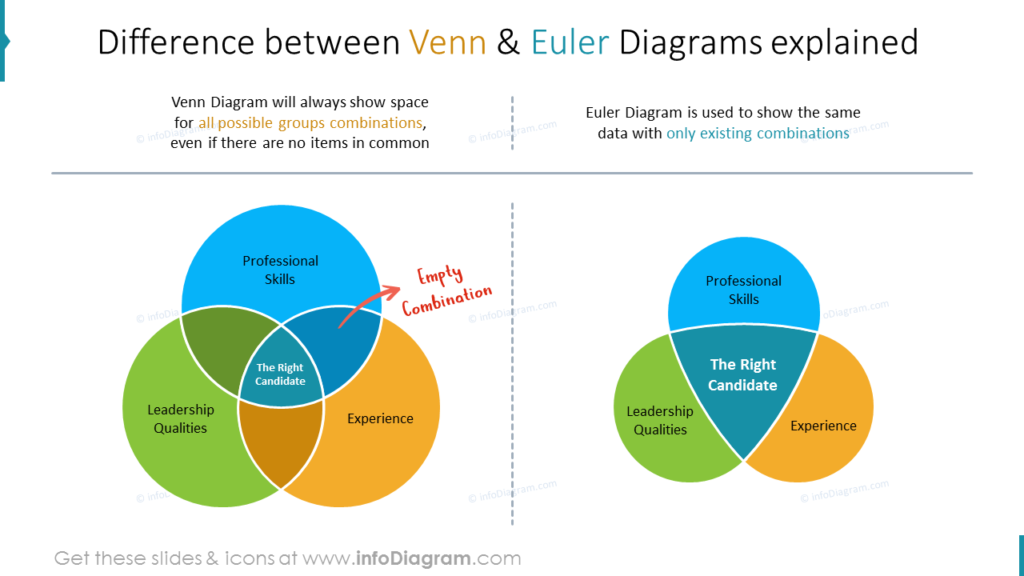
Euler Diagram is particularly useful for explaining complex hierarchies and overlapping definitions. The location of shapes represents relationships among several parameters or variables. They are similar to Venn diagrams (for comparison see examples in this Venn Diagram Template), however, the Euler diagram presents only relevant existing combinations, while the Venn diagram shows all possible overlapping possibilities, even if there are no items in common.
Euler diagrams will help you to include, exclude, and intersect results in simple visual schematics supporting your analysis and conclusions that as a result may be clearly evaluated by the audience.
Check the following cases of how you can illustrate complex ideas and relations using Euler diagram visuals. In the end, you’ll find a practical step-by-step guide on how to visualize Supranational European Bodies.
Usage example: Euler Diagram explaining the British Isles
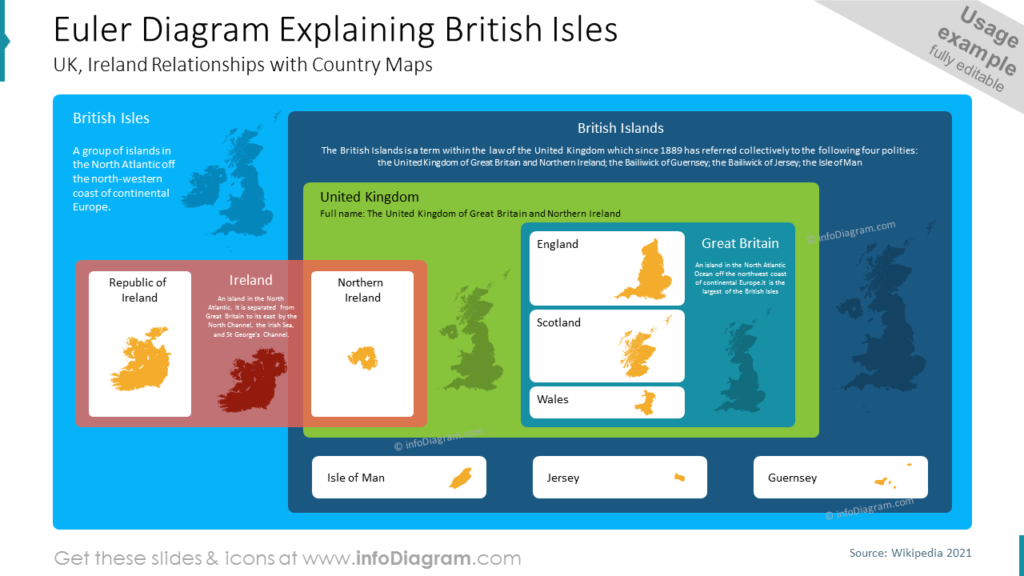
To show complex connections between objects, you can use such a slide with mapped relations. We illustrated the difference and connections between the British Isles (a group of islands in the North Atlantic off the north-western coast of continental Europe) and British Islands (the United Kingdom of Great Britain and Northern Ireland; the Bailiwick of Guernsey; the Bailiwick of Jersey; the Isle of Man).
Present features of the right candidate

If you want to show three needed characteristics, consider using such an Euler diagram. In our example, we presented the needed features for the candidate profile: Leadership Qualities, Professional Skills, and Experience. It’s always a good idea to support text with symbols: icons of compass, tools, and stars illustrate 3 talent management categories.
Visualize shared customer promise
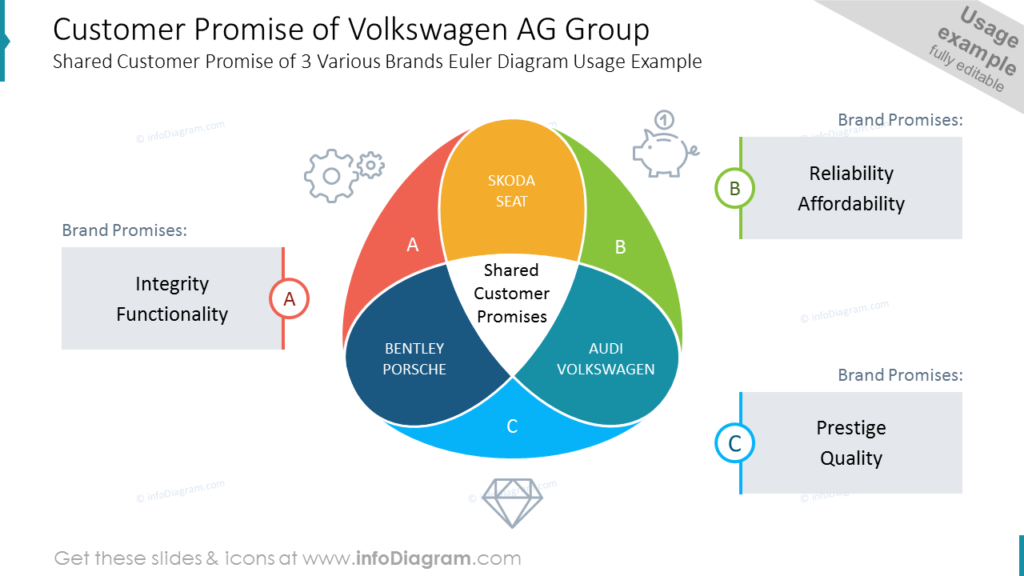
To be sure every detail is included and the slide is still readable, illustrate such compound concepts as customer promise with a diagram. On the slide, you can see the brand promise example case of Volkswagen car maker. See how the diagram covers elements as Integrity, Functionality, Reliability, Affordability, Prestige, and Quality, visualized with different icons and colors.
Show shared services in company divisions
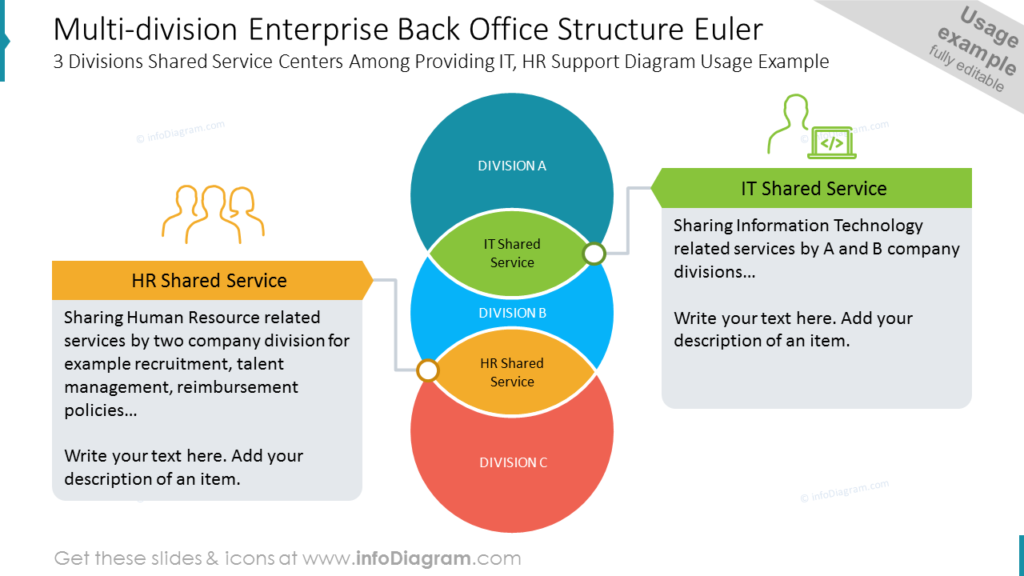
If you need to present dependencies between company areas, like a multi-division enterprise structure, the Euler diagram can be a good visual tool for that.
On the slide above, you can see the diagram, illustrating three divisions of shared service centers providing IT and HR support.
Explain sorting criteria using the Euler diagram
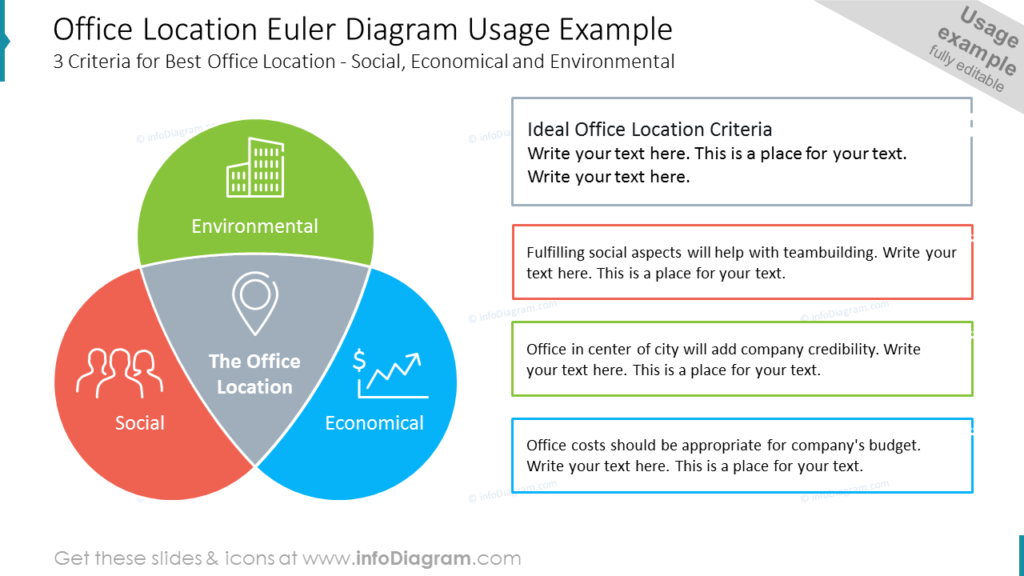
To present motives and reasons behind your decision, you can use a slide with a diagram and a place for notes.
In our slide example, you can see how we showed three criteria for the best office location – social, economic, and environmental reasons.
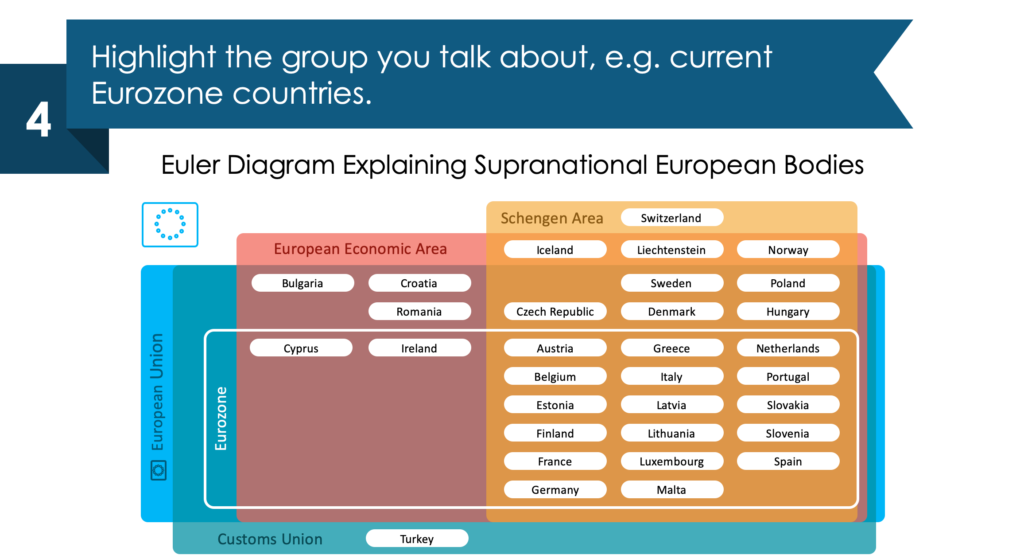
Guide on how to create Euler diagram infographics to show Supranational European Bodies
Check out a quick guide showing how you can transform a standard table with grouping tags into a visually pleasing infographic with easy-to-see relationships. You can see an example where we visualized Supranational European Bodies, which you can reuse for describing any complex connections.
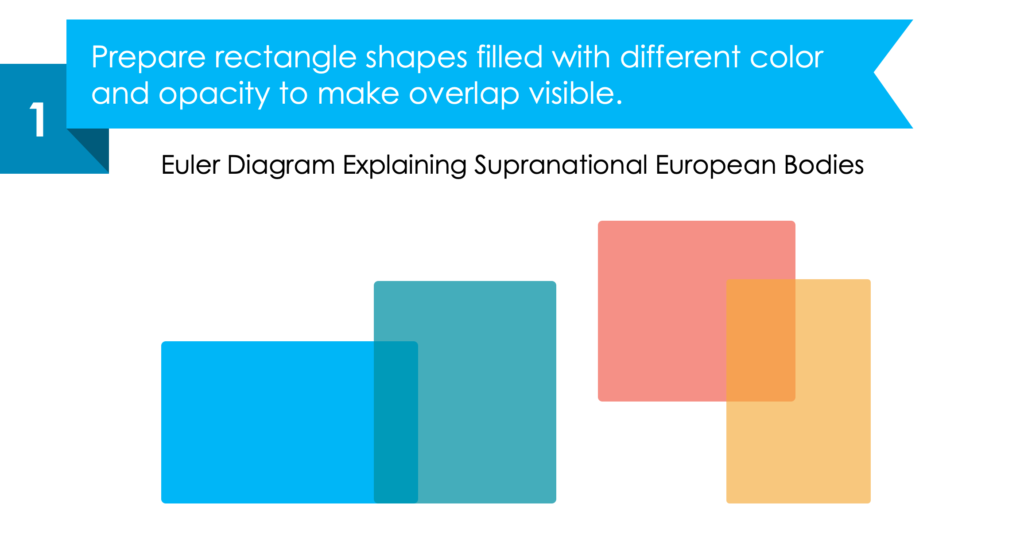
1. Prepare rectangle shapes filled with different colors and opacity to make overlap visible.
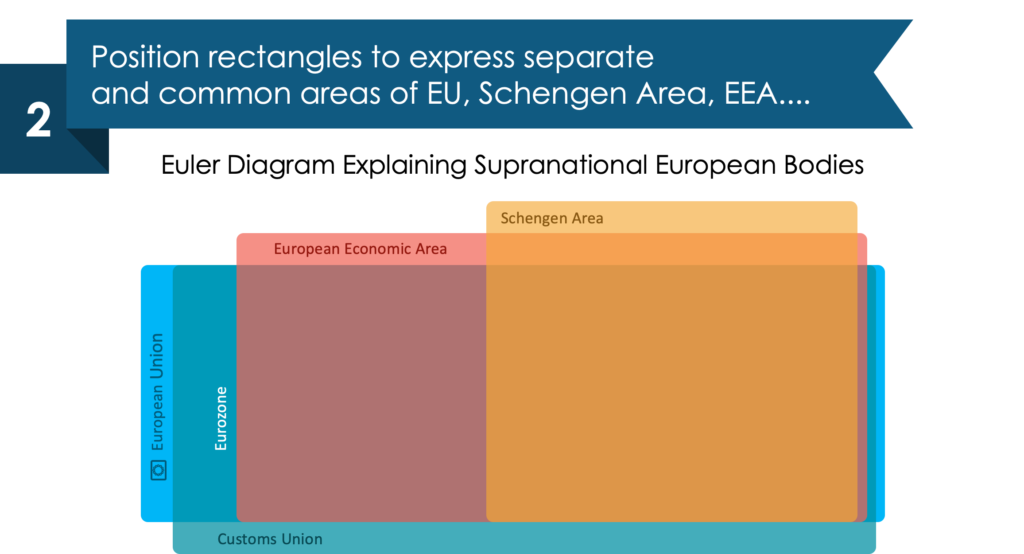
2. Position rectangles to express separate and common areas of EU, Schengen Area, EEA, etc.
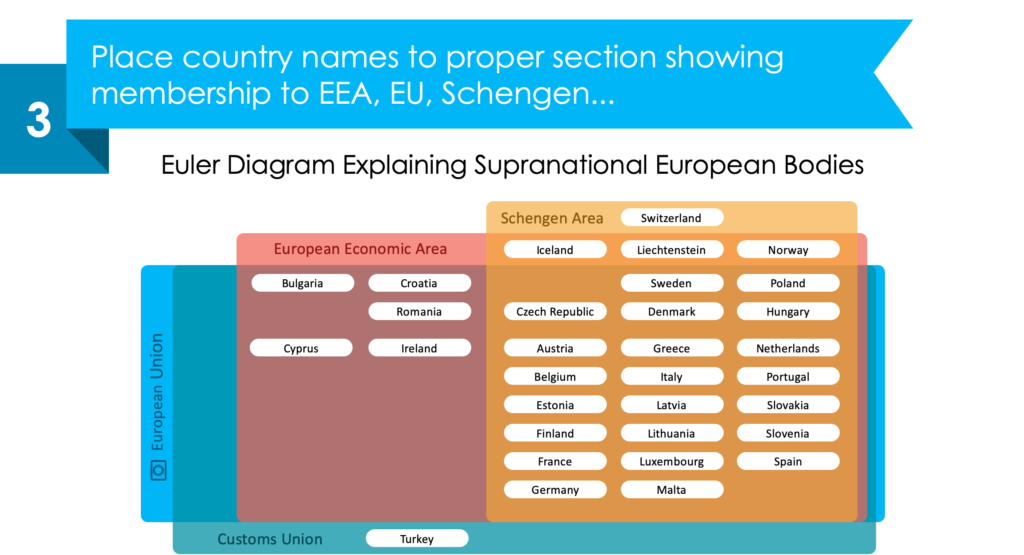
3. Place country names in the proper section showing membership to EEA, EU, Schengen, etc.
4. Highlight the group you talk about, e.g. current Eurozone countries.
See the whole step-by-step instruction on our YouTube channel:
Resource: Euler Diagrams of Set Relationship
The examples above are only a part of our Euler diagrams PPT collection. You can reuse our predesigned diagrams and tailor them to your needs in order to upgrade your presentation slides or any document. Our templates will help you depict various kinds of data and information in a more appealing manner. We also included detailed instructions on how to alter the content, colors, look and feel of our slides. Click on the button to see the full slides deck:
Want to do even more customizing? Diagrams and charts from this collection of professionally designed editable diagram templates might help you take your next PowerPoint further and will make the process of preparing the next presentation less time-consuming.


