PowerPoint Timeline Graphics: 3 Creative Ideas You Need To Try
The beauty of graphical timelines used in presentations lies in their fast comprehension. Everybody knows how to read them and see where’s beginning and where’s next step. Unlike in the case of some special data charts. PowerPoint timeline is also easy to create and flexible to modify. You can present exact dates or just show events and actions in a particular sequence.
In this blog, we’ll walk you through three simple ideas on how to add unique and eye-catching PowerPoint timeline graphics to your next presentation.
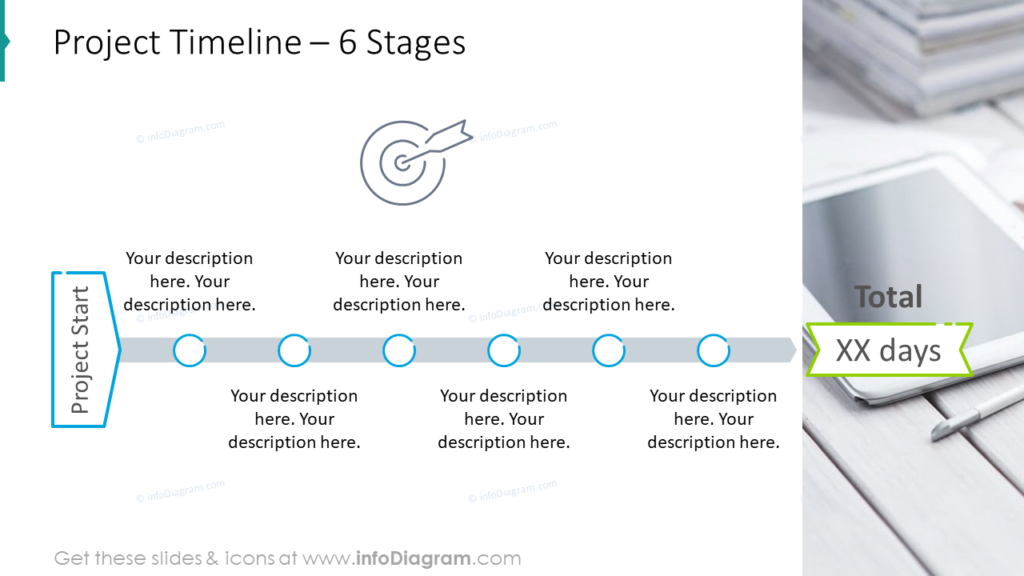
#1: Timeline representing the stages of a specific project
In this scenario, precise dates are not provided. Instead, we indicate key stages with descriptions on the timeline (represented by an arrow or chevron). We only show the final project’s duration in days at the end of the axis.
Such a timeline graphic is easy to extend, you just need to add or remove new circles and distribute them evenly on a grey timeline arrow.
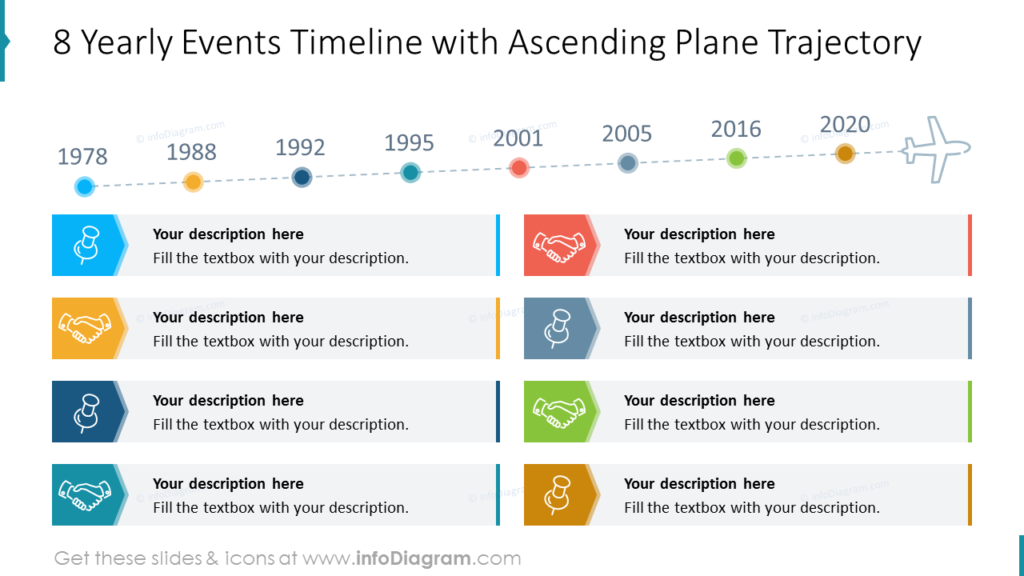
#2: Company’s history timeline presentation
Here we present a yearly development of a company. Our timeline items are specific years from an organization’s history. To underline the growing trend, you can create a slightly rotated horizontal line that increases towards the end.
We spread those years chronologically on the timeline and assign different colors to them. Each colored point corresponds to a frame containing a description of the event that occurred that year. Color coding will help your audience to stay focused during your presentation and comprehend large amounts of information.
Additionally, we have assigned icons to illustrate each stage.
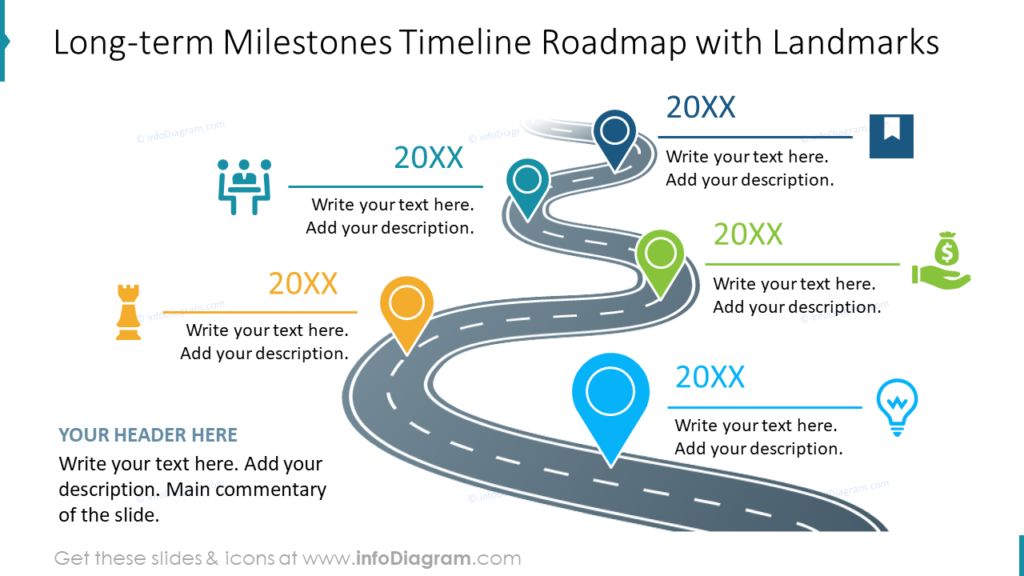
#3: Timeline illustrating milestones
The timeline doesn’t always have to be linear. Especially if you want to put more points on a timeline, the width of a slide may not be enough. In such a case, consider using a curvy line, like the one below.
However, you need to make sure to indicate in which order to read such a timeline, and where is its beginning. You can do it following a natural way of reading the screen from left to right, and by numbering the events, as demonstrated in this instance of showcasing milestones.
The end arrow directs toward an icon indicating financial growth, providing insight into the desired outcome.
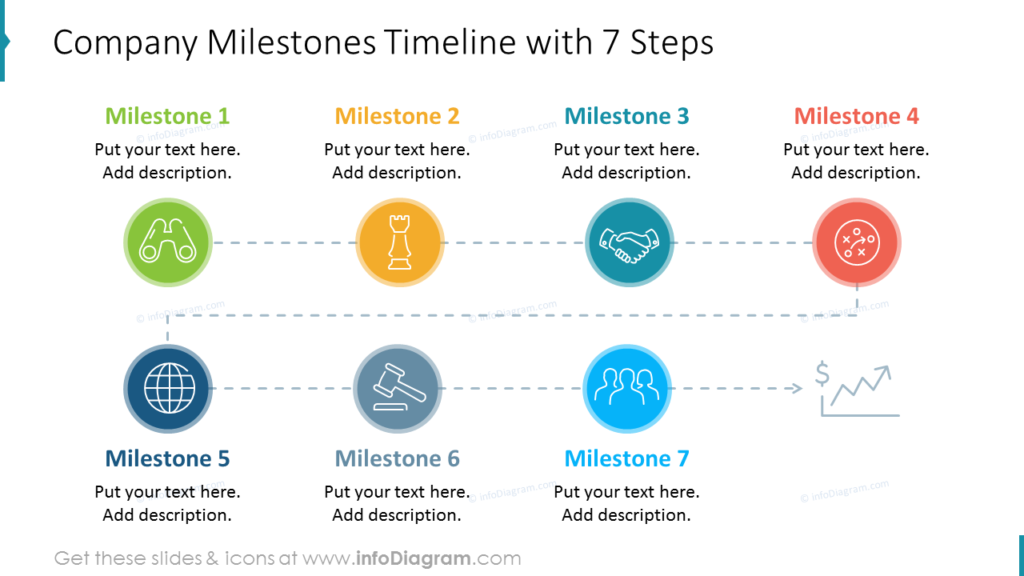
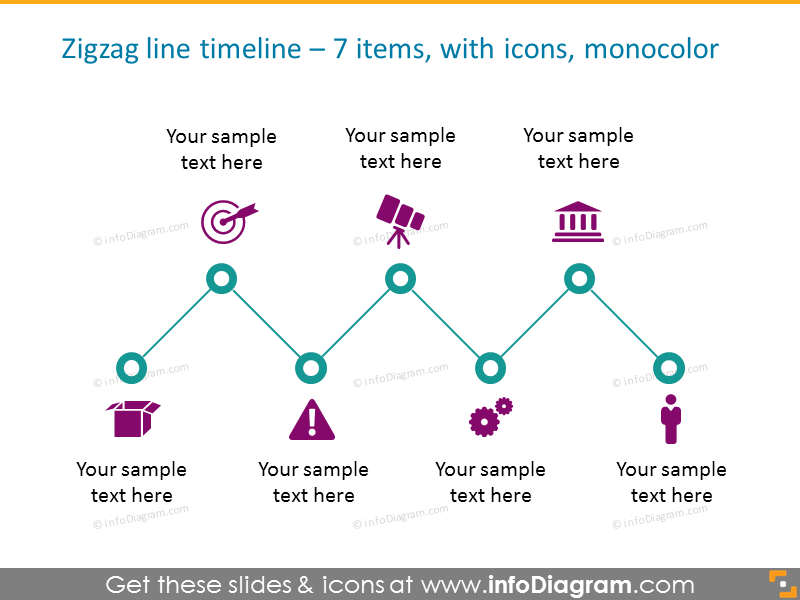
Enriching timelines – adding symbols to represent milestones
A good practice to make timeline points remembered is to represent each milestone with a graphical symbol. Just make sure the size and style of the symbols are consistent.
Here are a few examples of the milestone timelines, where each stage is shown with a specific symbol:
By exploring the three PowerPoint timeline ideas presented in this blog, you can develop a better understanding of how to use timelines to organize and visualize data in a compelling way.
Whether you are creating a timeline of your organization’s history, showcasing development milestones, or presenting a project’s timeline, the possibilities are endless. With a little creativity and attention to detail, you can create informative and clean timelines that will enhance the impact of your slides.
Further Inspiration
If you are looking for more timeline design ideas, explore the following blogs:
- 7 ideas for creative timeline design
- Explain timelines with plane & journey analogy
- How to illustrate company history in PowerPoint
Get our free sample with an example of a timeline diagram and stay tuned for more resources.


