Market Research Presentation: Tips & Visual Slide Ideas for PowerPoint
Make your market research presentations more engaging with visual PowerPoint slides. Tips, layouts, and template ideas for presenting survey data and competitive analysis.
Are you struggling to captivate your audience while presenting market research findings? Such presentations usually have a form of PowerPoint slides that contain lots of data. It can be challenging to create a presentation that will keep your audience engaged for a longer time. In this article, we will explore the best practices, providing you with practical tips and illustrative examples for your market research presentations.
With the ever-increasing competition in the business world, it’s crucial to deliver market research presentations that are not only informative but also clear and easy to follow. Whether you are presenting to potential clients or internal teams, the way you present data and findings can make or break your success.
Understanding your audience for better engagement
One of the first steps towards mastering market research presentations is understanding your audience. Each audience is unique, with different knowledge levels and preferences. By tailoring your presentation to their specific needs and interests, you can keep them engaged throughout.
For example, if you are presenting to a group of executives, focus on high-level insights and strategic implications. On the other hand, if your audience consists of analysts or subject matter experts, you can dive deeper into the methodology and data analysis.
The typical structure of market research presentations
Market research is a systematic process of gathering, analyzing, and interpreting data related to a specific market or industry. It involves the collection of quantitative and qualitative data, as well as the evaluation of market trends, consumer behavior, and competitive landscapes to identify opportunities and mitigate risks.
These are the parts typically present in market research presentations:
- market analysis: evaluation of the target market’s size, growth potential, and segmentation, as well as an assessment of current and future market trends
- ideal customer analysis: profiling and understanding the characteristics, needs, preferences, and behaviors of the target customer base.
- competitive landscape: research of the competitors’ products, pricing, marketing strategies, and market share to identify strengths and weaknesses.
- SWOT analysis: identifying internal strengths, weaknesses, external opportunities, and threats, to formulate effective strategies.
If you’re working on a market analysis presentation, see more visualization ideas here.
Let’s dive into specific visual examples you can use to illustrate each part of the market research report.
You can click on all example images to see details and download the source PowerPoint files.
#1: Market analysis slides
Market analysis is a fundamental component of market research presentations, providing a comprehensive assessment of the specific market or industry under consideration. This phase involves thoroughly examining various aspects, typically including the market’s size, growth potential, segmentation, total addressable market (TAM), and identifying relevant submarkets or niches.
Below you’ll find a few slide ideas you can reuse.
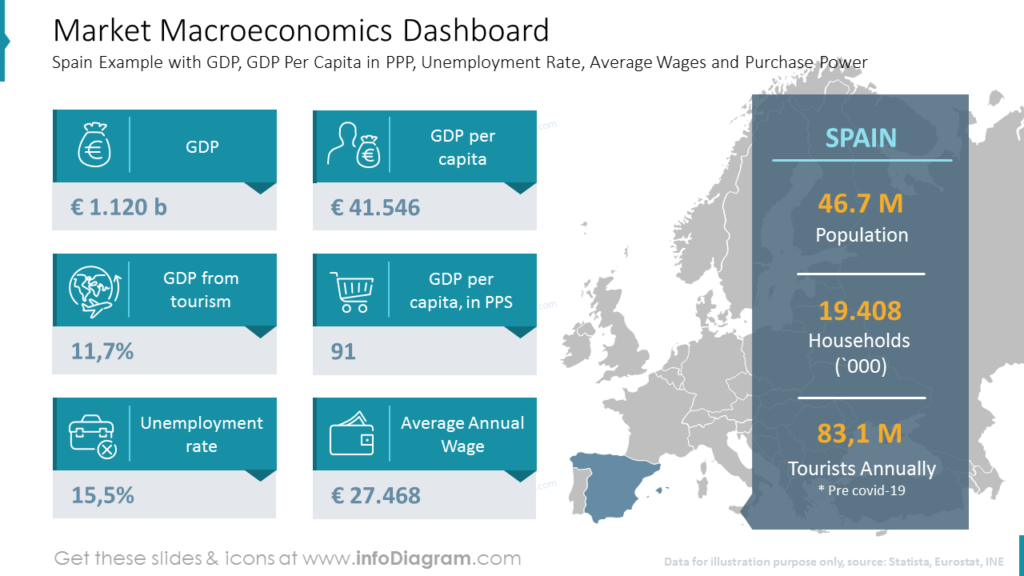
When you analyze a specific country, you can present its macroeconomic data on one dashboard slide. Notice in the picture below how we embedded a map and several key data about the analyzed country – here Spain and its population, GDP, number of households, and tourists annually.
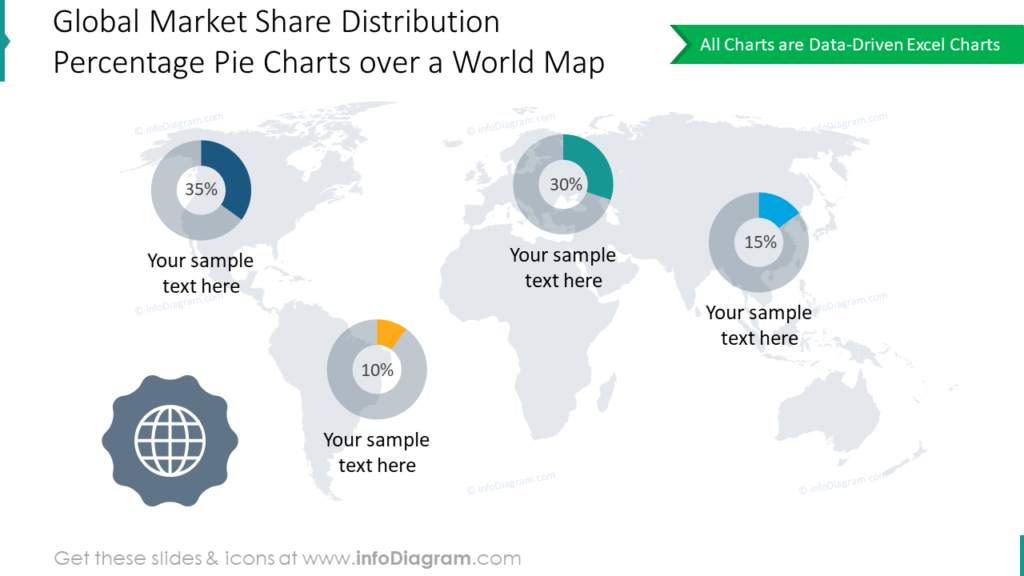
Another example of market analysis is this PowerPoint slide – presenting global share distribution as a series of pie charts over the world map.
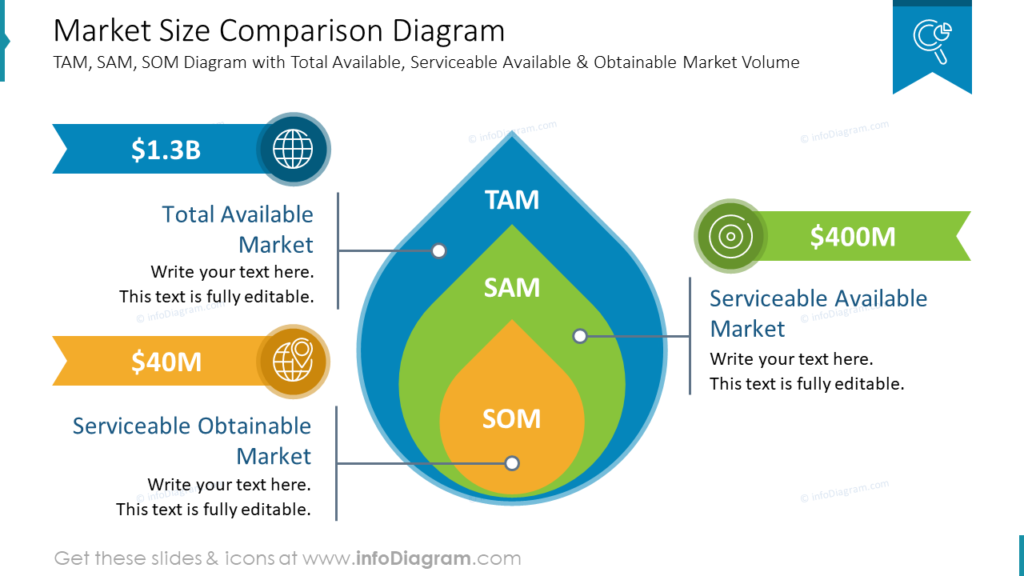
You can present the size of the market with an eye-catching onion diagram in the shape of a teardrop. Such a diagram shows three embedded layers of TAM – Total Available Market, SAM – Servicable Available Market, and SOM – Servicable Obtainable Market.
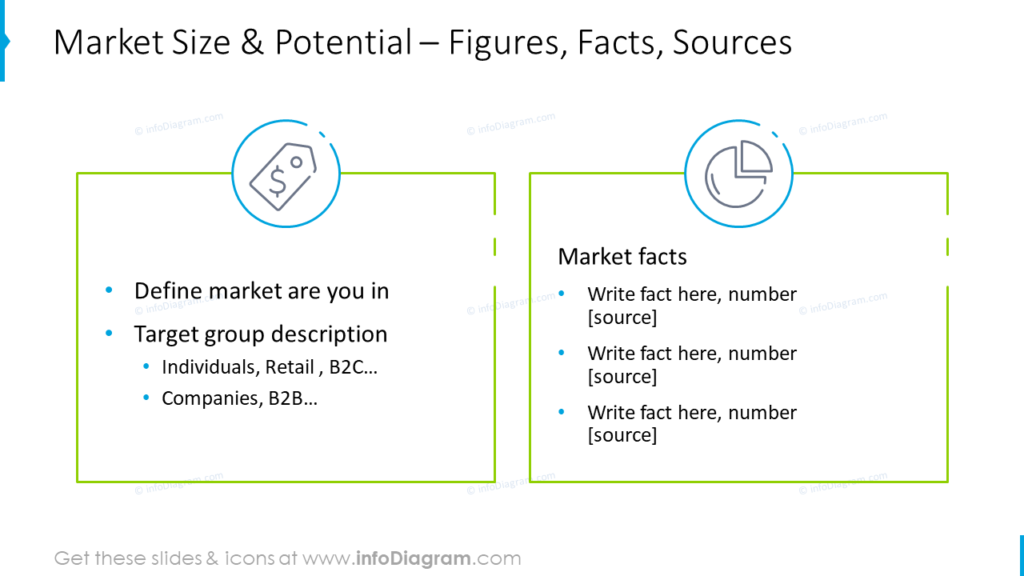
Here’s another graphical PowerPoint slide inspiration with a description of market size and its potential. We presented these data in the form of a two-column layout.
#2: Customer analysis
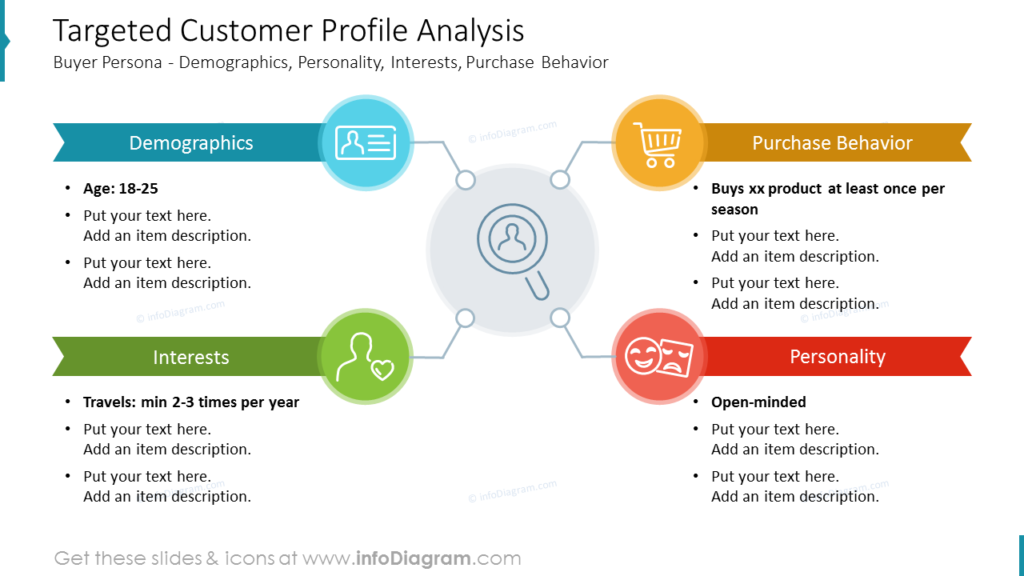
Customer or target persona analysis involves demographic assessment (age, income, location), psychographics (lifestyle, values), and behavioral analysis (buying habits, brand loyalty). It helps businesses segment their audience and create personalized strategies and products that cater to customer needs and preferences. Additionally, customer analysis often involves crafting customer personas to guide decision-making and foster strong customer relationships.
You can illustrate targeted customer profiles by dividing data into 4 sections: demographics, interests, purchase behavior, and personality. On the slide below, each section is color-coded and illustrated with icons. It will help your audience to stay focused and not get lost in the walls of text and bullet points.
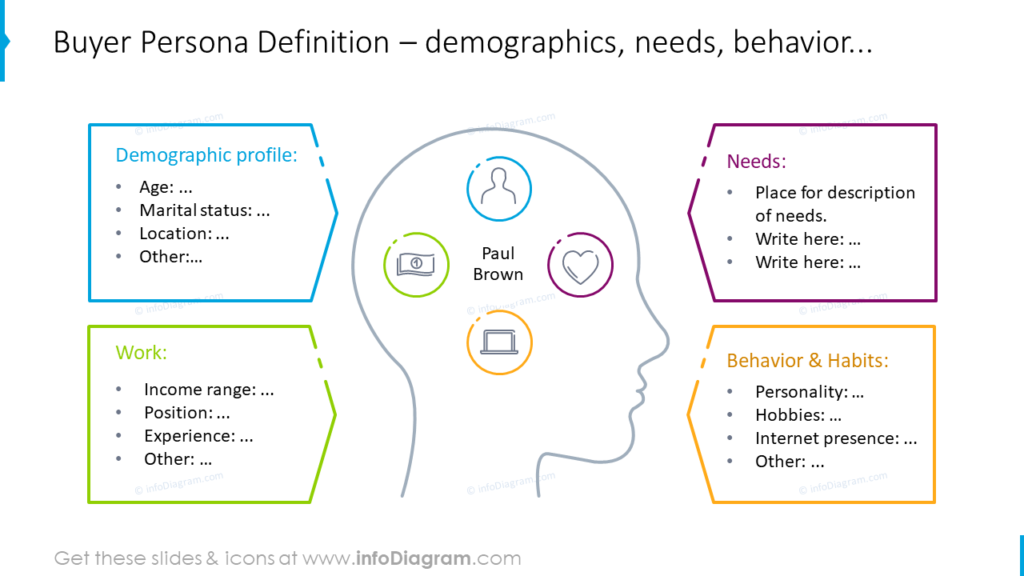
Here’s another slide inspiration that shows a silhouette of a person’s head with a variety of information about them, including their profile, needs, habits, and behavior.
Here’s one more way of presenting your ideal customer: a simple layout divided visually into 2 parts. You can highlight any important points with hand-drawn markers and show some concepts with icons.

If you’d like to focus more on target customers and their profiles, explore more ideas in this blog.
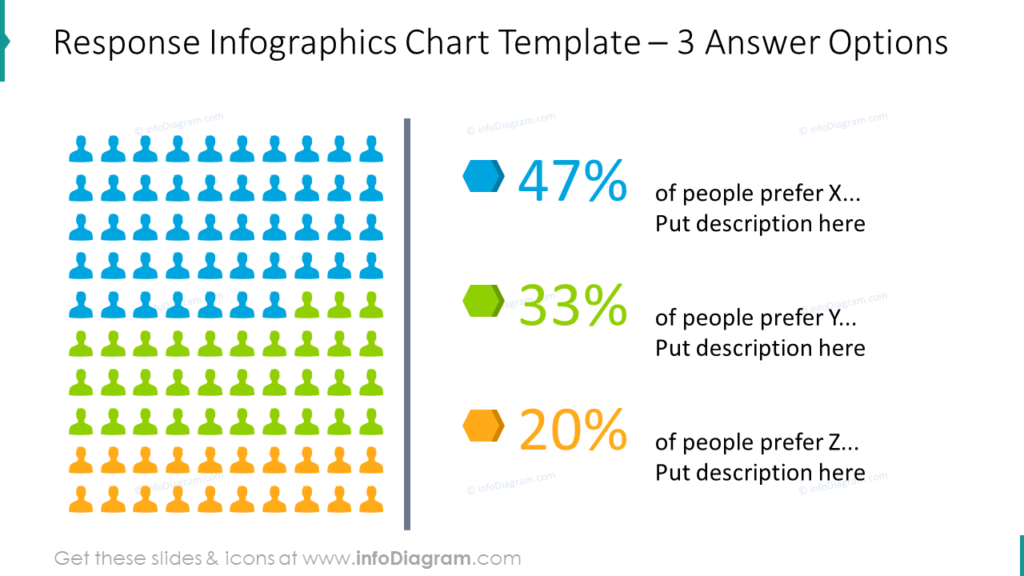
You can also show the survey results visually (if you conducted any polls). For example, using a response infographic slide with 3 or more answer options. The slide below shows the percentage of people who prefer X, Y, and Z. This chart is a simple and effective way to visualize survey results, and you can easily customize all elements to your needs.
#3: Competitive analysis
Competitive landscape analysis entails assessing the strengths and weaknesses of competitors operating in the same market or industry. It involves identifying key competitors and comprehensively examining their products or services, pricing strategies, market share, and distribution channels.
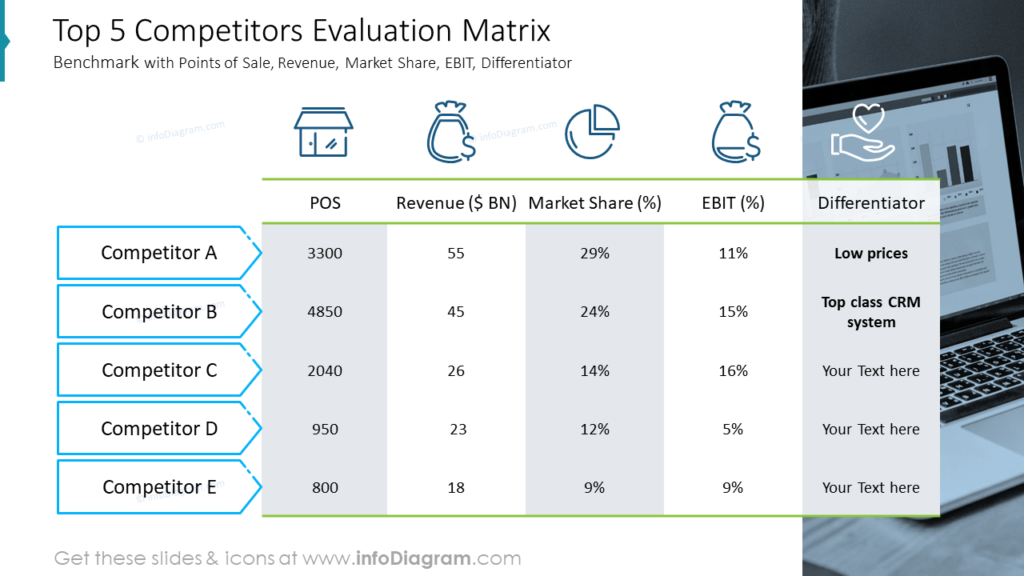
While analyzing competitors, you can illustrate the results using a table or matrix layout, which will help your audience quickly see the differences between them. In the example evaluation matrix, we included the POS, sales revenue, market share, EBIT, and differentiator of the top 5 competitors.
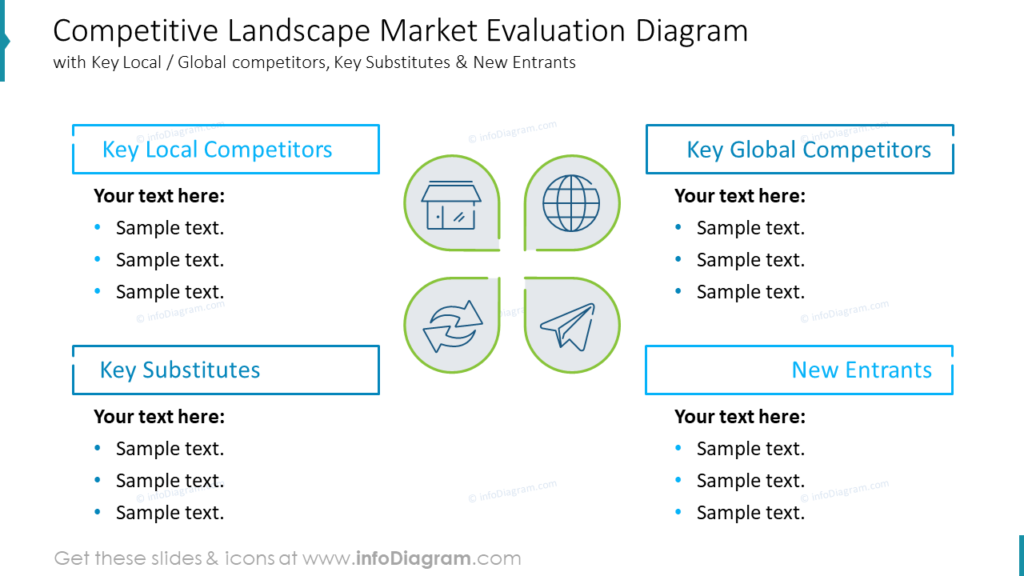
Another example of competitive landscape analysis is this PowerPoint slide. This diagram includes the wider picture of competitors in the market:
- Key local competitors: competitors that operate in the same geographic area as your business.
- Key global competitors: competitors that operate in multiple geographic areas, including your own.
- Key substitutes: products or services that can be used instead of your product or service.
- New entrants: new businesses that have recently entered the market.
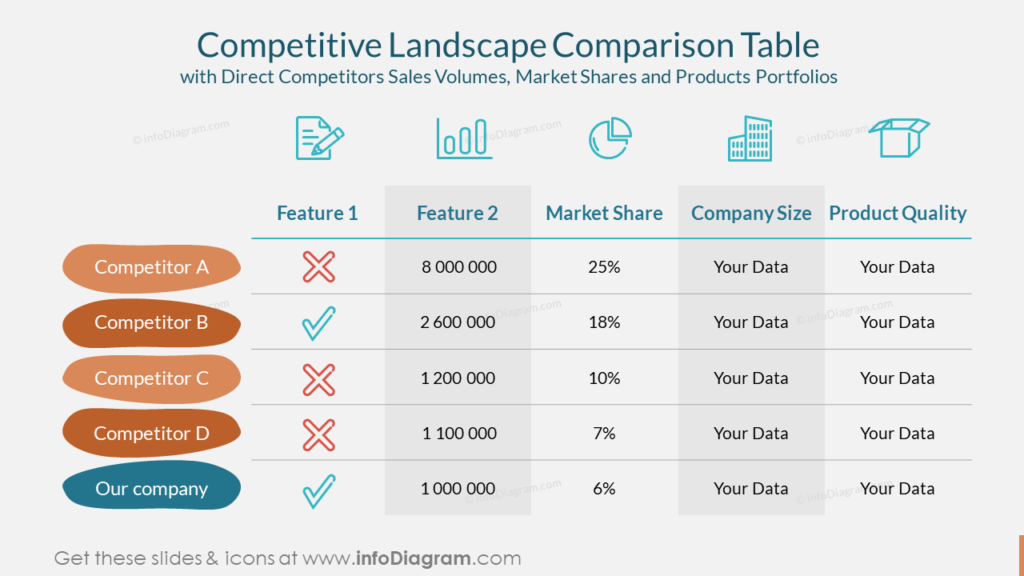
Here’s an example of presenting a competitive landscape in a more creative style. The table includes sales volume, market share, and product portfolio comparisons.
You can also benchmark against industry best practices, which will help you to identify areas for improvement and formulate strategies to surpass competitors.
#4: SWOT analysis
By using SWOT Analysis, you can assess a business’s internal strengths and weaknesses, along with external opportunities and threats. It helps identify resources, expertise, and competitive advantages (strengths), as well as operational inefficiencies or limitations (weaknesses). Simultaneously, it evaluates favorable market circumstances like emerging trends or untapped customer segments (opportunities) and external factors that could harm the business, such as competition or regulatory changes (threats).
Here are a few visualization ideas to try:
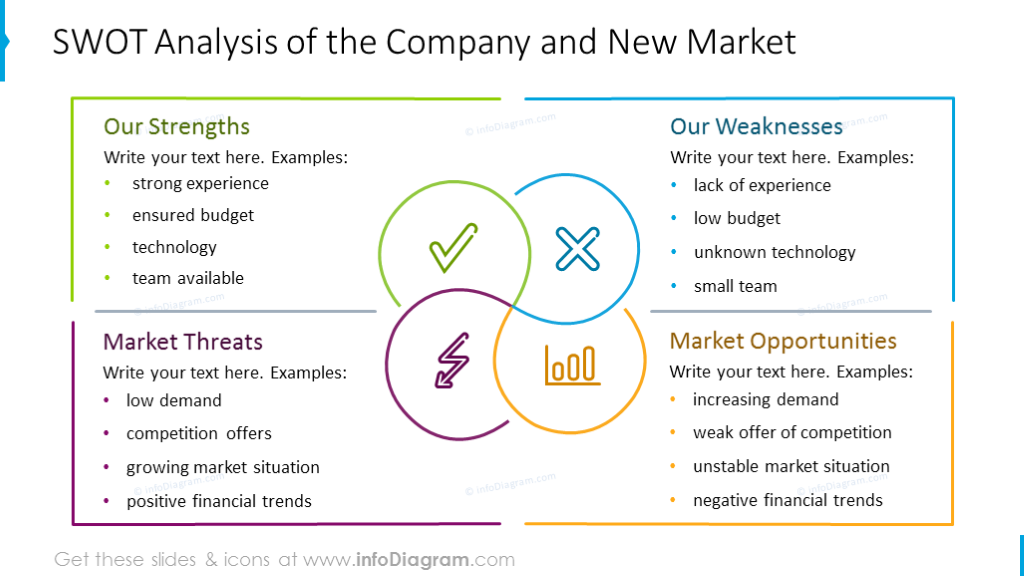
Here’s an elegant and minimal SWOT analysis matrix for a company and a new market. The matrix lists the company’s strengths, weaknesses, market opportunities, and threats.
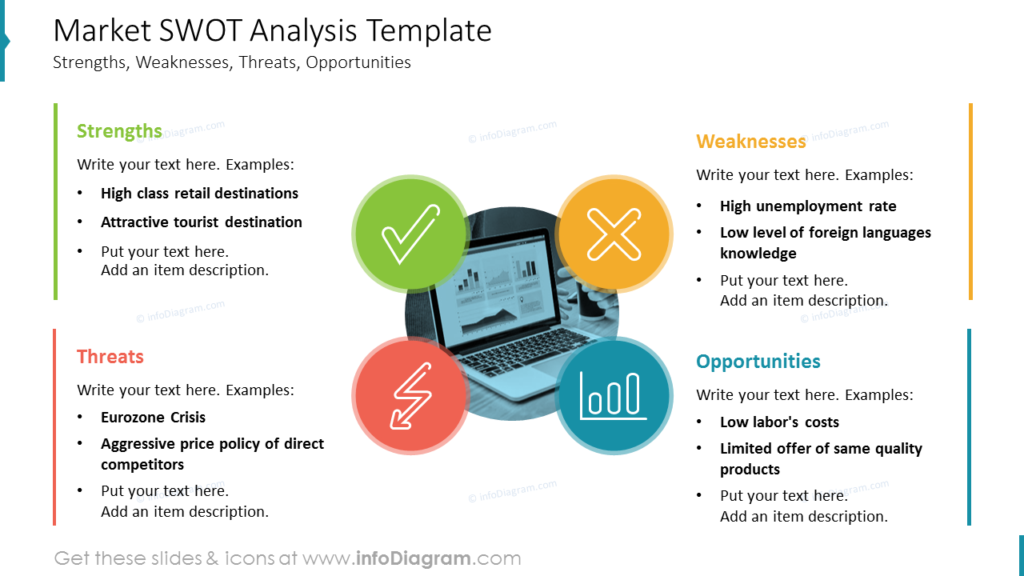
Here’s another example of a market SWOT template, including a background image and more distinctive icons illustrating its four components:
Best practices for creating visually appealing market research presentations
To sum up, creating attractive professional-looking slides is a crucial aspect of mastering market research presentations. The visual part plays a significant role in capturing your audience’s attention and making your data more accessible.
Follow these tips to ensure your slides are visual and engaging:
- Choose the
rightsimple clean design. Avoid cluttered or overwhelming designs that distract from your message. Instead, opt for clean and modern templates that enhance the readability of your content. - Utilize colors that complement each other and provide good contrast to ensure that your audience can easily read the text on the slides. Keep the consistency throughout the whole presentation.
- In terms of data visualization, strive for simplicity and clarity. Use charts, graphs, and infographics to present complex data in a visually appealing way. Avoid overcrowding your slides with too much information.
- Consider incorporating light way of images and icons to enhance the visual appeal of your presentation. Use relevant and high-quality visuals that support your message. Images can help evoke emotions and make your presentation more memorable. Remember the images are only an addition, they should not steal the show.
By following these best practices for creating visually appealing market research presentations, you can effectively convey your message and keep your audience visually engaged.
Related Resources
Here are more resources to get you going:
- 10 slide ideas for effective go-to-market strategy plan presentation
- Ideas for presenting market analysis
- Templates for powerful marketing strategy presentation
Follow our YouTube channel, and subscribe to our newsletter for more design tips and slide inspiration.


