How to Transform Raw Text to Structure Slide in PowerPoint
Turning text into visuals is a practical and effective way to illustrate information. In our fast-paced digital era, visual communication has emerged as an essential tool to capture attention and convey complex ideas. In this blog post, we delve deep into how you can design the structure slide from the text block and create a more engaging presentation.
The Starting Point
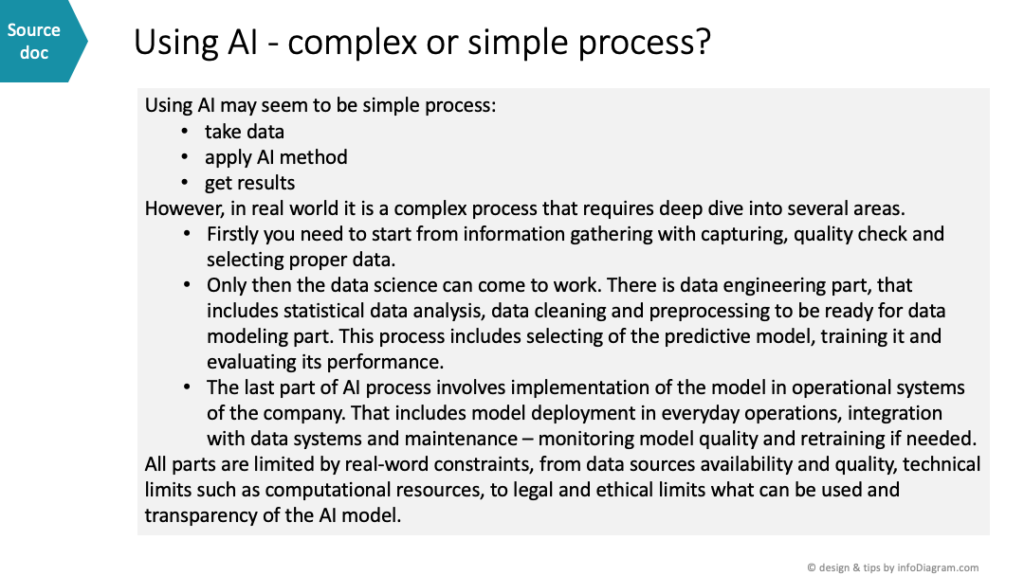
The journey begins with a text document. Here I will use an example of a text document describing the AI process. This document will be our foundation as we morph it into an instructive diagram.
Before any design begins, it’s pivotal to spend some time understanding the content and analyzing it thoroughly. Only then can the structure slide design truly begin.
Analysis: Deciphering the Text
Breaking down our source, we find a narrative describing the AI process. From a general eye view, it’s a three-step procedure. However, as we delve deeper, the intricacies of this process emerge, with the latter part of the text revealing the hidden structures.
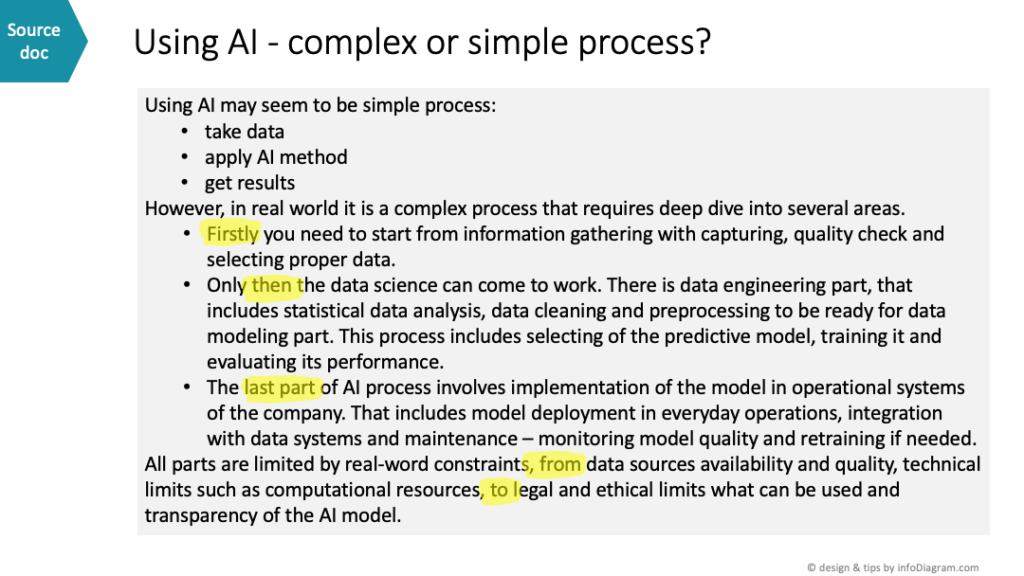
What can help is spotting specific words like “First”, “Then”, and “Last part” which gives away the type of diagram to be used, suggesting a process flow diagram. Similarly, bullet points, whether explicit or hidden within sentences, can be used as an indication to use a list diagram.
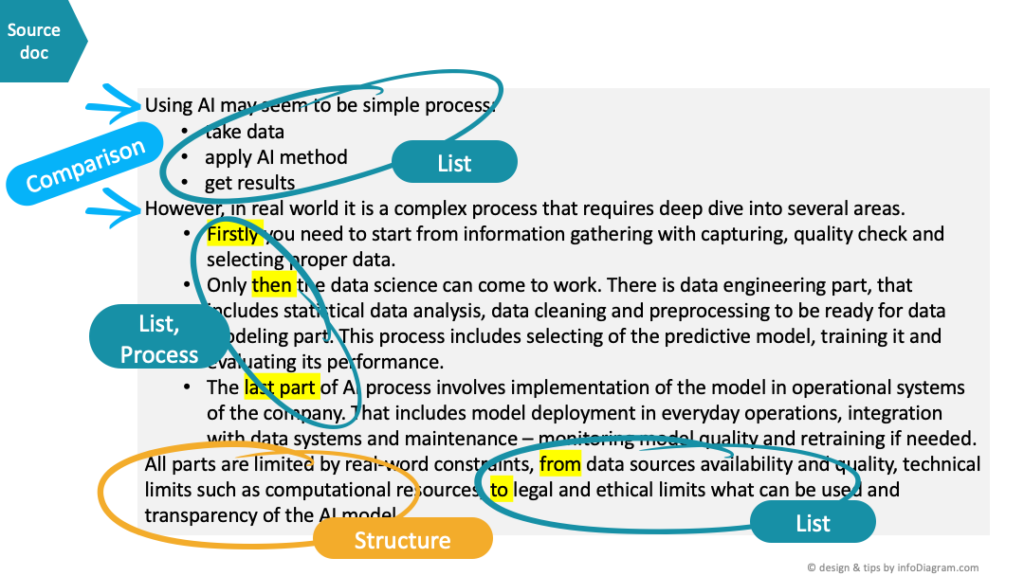
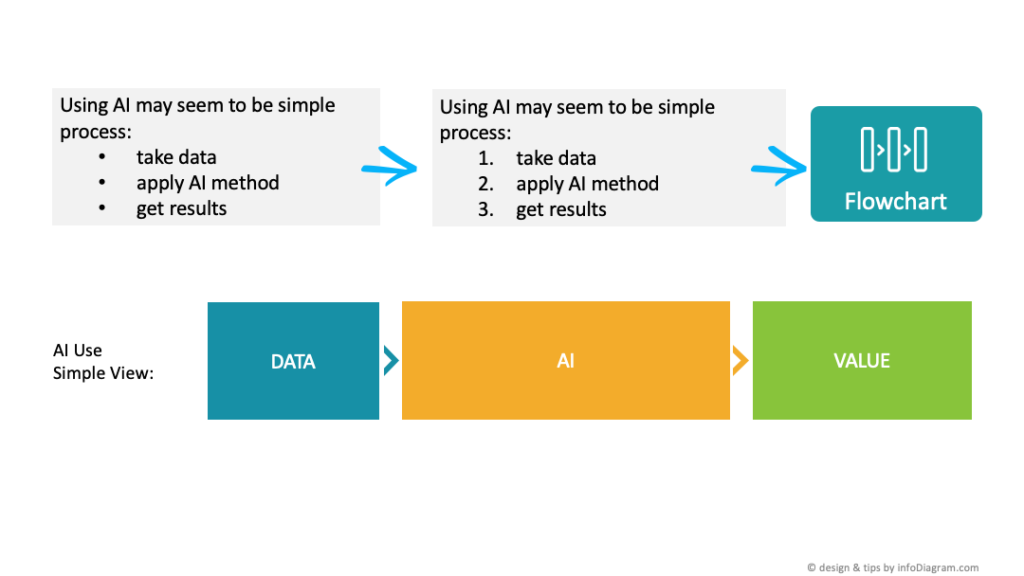
You may notice the text sets two contrasting perspectives on AI implementation:
- Using AI as a simple process
- Using AI as a complex process
We can use that fact to create a comparative visual representation. Moreover, the bullet points can represent a graphical list. Inside the text, the bullet points contain additional information about the order, which is the process. Therefore, we can represent by a flowchart diagram.
Redesign: Breathing Life into Analysis
Before leaping into the redesign, it’s essential to understand the basic types of diagrams. They serve as our toolkits, enabling us to craft the perfect visual representation.
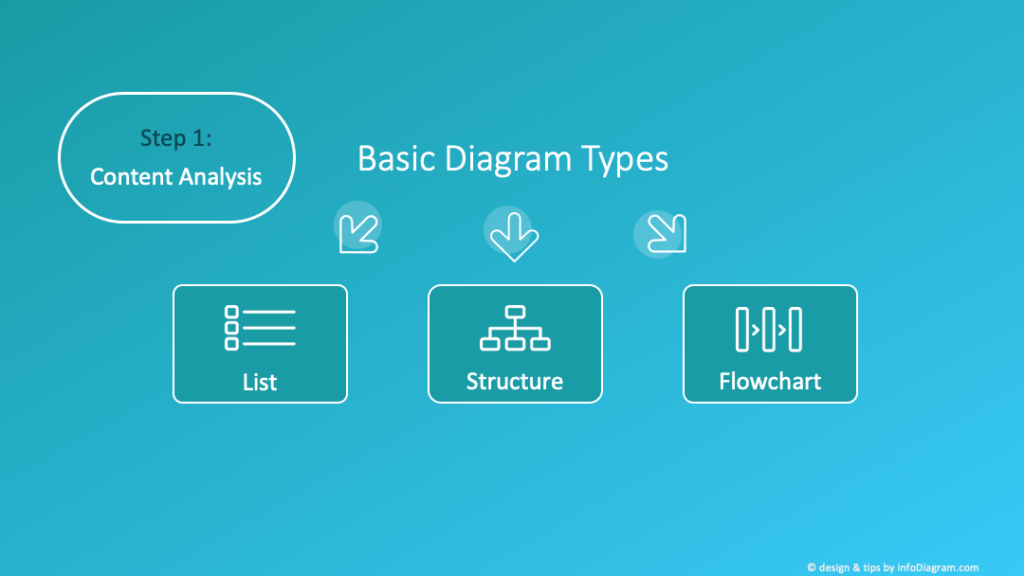
Depending on the content, whether it’s a list, a structure, or a process, we can recognize three basic categories of diagrams
- The list diagram is ideal for organizing a list of items, often represented as a simple set of boxes.
- When it’s essential to express the location or hierarchy of items, the structure diagram is recommended. This diagram can illustrate relationships such as items being above or inside others, showcasing dependencies and hierarchies.
- Flow chart diagrams should be considered if you need to highlight a sequence or order of information.
So let’s use it with our text. In the first part of the text, we reference three key stages of the AI implementation process.
Given that these three items follow a specific sequence
- starting with data collection
- applying the AI method
- obtaining results
— it would be more coherent to represent them as numbered items. This sequence is precisely why a flowchart diagram is suitable. A fundamental flowchart, at its core, consists of rectangles containing text, connected by arrows to indicate progression.
Slide design tips for illustrating diagrams
You can beautify the structure slides with illustrations such as icons. The simplest form of illustration is adding icons. For example, the icon for data can be a database symbol. The icon for AI can be a man with some gears in the head as a symbolic representation of artificial intelligence. For more ideas on how to find an icon for the abstract terms, check out the blog post on Abstract Concepts visuals with 60+ terms and icons with ideas of specific icons.
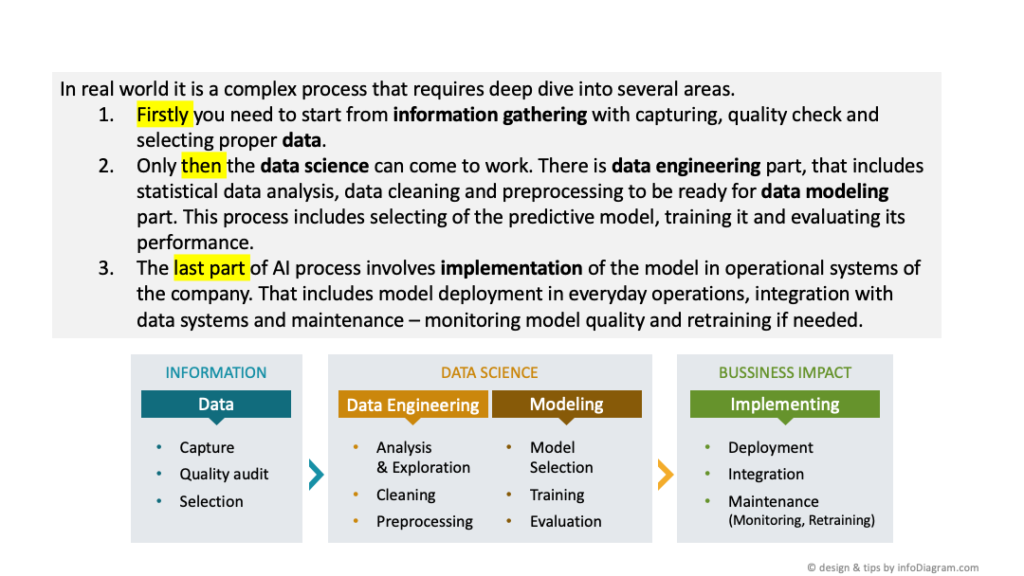
Diving deeper, the text’s second segment, explaining AI’s real-world application, demands a more detailed flowchart, split into ordered sections.
- In the text, the first part involves “information gathering” for the AI process.
- This is followed by the second part, which is dedicated to “applying data science”.
- The last section talks about the implementation of the AI process.
You can notice that within the second segment, there are several steps, including the data engineering and data modeling phases. Each of these phases can be further broken down. Specifically, the data engineering segment contains three bullet points, while the modeling phase has an additional three.
Design tips for diagram creation
When detailing these steps, it’s crucial to correctly categorize each detail under its appropriate point. To ensure clarity in your structure slide, employ color contrast. Prioritize the visibility of primary information. Key terms should stand out with darker backgrounds, followed by subpoints and then the finer details within the bullet points. Upon assembly, we see two contrasting AI views. One is a high-level simplistic approach, and the other is a detailed, comprehensive view.
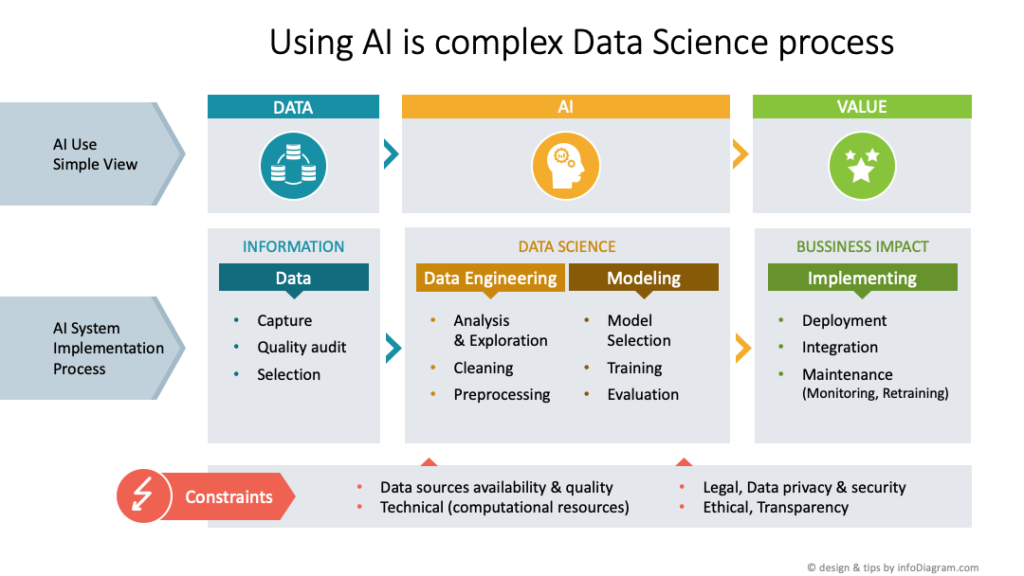
Let’s finish the text analysis. The last paragraph of our source text addressed the entire process of using AI, indicating that all parts are bound by certain constraints.
This is the information of the “structure” type, considering the 3 diagram types we mentioned above. To convey this structural information visually we can create a block diagram. Use a simple shape, such as a wide rectangle. It can be placed over all steps, denoting its overarching relevance to all three blocks. Instead of explicitly stating its purpose, the intent can be simply displayed by positioning one rectangle beneath all three sections.
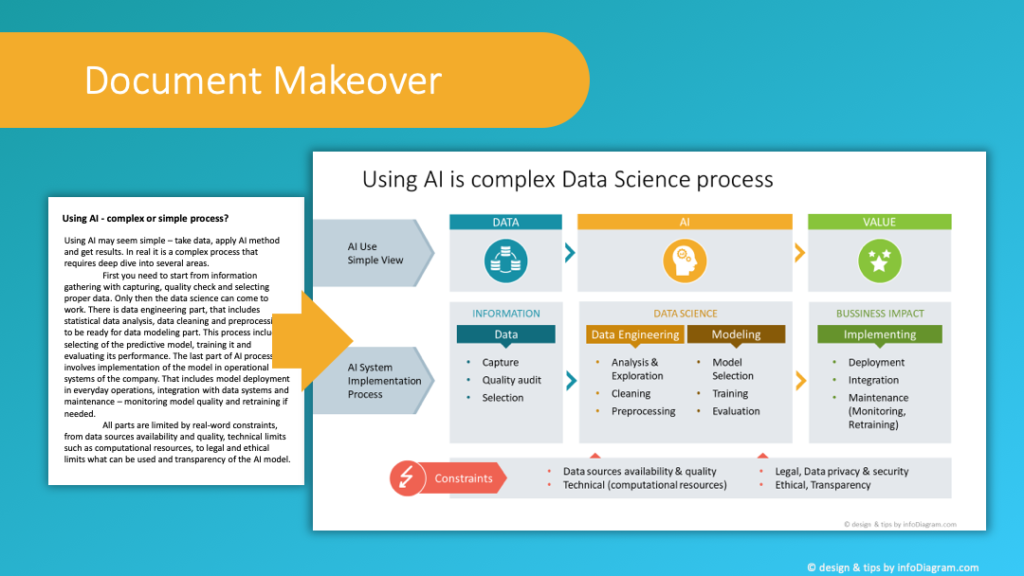
Have a look at the final structure slide below. This visualization captures the essence of the information originally presented as a lengthy text.
Conclusion of using diagram form instead of text
After analyzing the text, understanding its content, and identifying the keywords that signify its structure, we transformed it into this type of diagram. This format is not only easier to understand but also simpler to present. The transformation from text to visual not only simplifies understanding but also enhances retention. As a naturally visual species, our brains process images faster than text.
To dive deeper and access additional tips, visit our website. After you sign up, you will receive free graphics as part of our know-how series, which consists of email tutorials focused on visualizing content.
Feel free to explore our library, brimming with thousands of editable diagrams and curated content-ready presentations. We also feature AI diagram PowerPoint templates, providing insight into the history of artificial intelligence and the structure of AI technologies. To further elevate your content, check the thousands of icons we’ve designed.
You can watch the full movie on our YouTube channel, don’t forget to subscribe🙂