How to explain Jobs to Be Done using diagrams in PowerPoint
Do you need to present the JTBD framework? Explain the Jobs to Be Done concepts visually to create a powerful presentation.
Grasp some ideas for showcasing this work management framework on graphical slides, covering the following topics:
- 8 steps of jobs to be done approach
- Presenting the JTDB term definition
- JTDB Statement examples
- Four elements of the JTBD framework
- Visual JTBD canvas
Get all the graphics presented here – click on the slide pictures to see and download the source illustration. Check the full set of Business transformation strategy presentation template.
What is the JTBD framework? A visual way of presenting term definition
The main definition is as follows: The Jobs to Be Done framework is a customer-centric approach to innovation and product development.
To present the definition on a slide, it’s a good practice to extend it to provide more details, and add some illustrations as we did on the slide below:
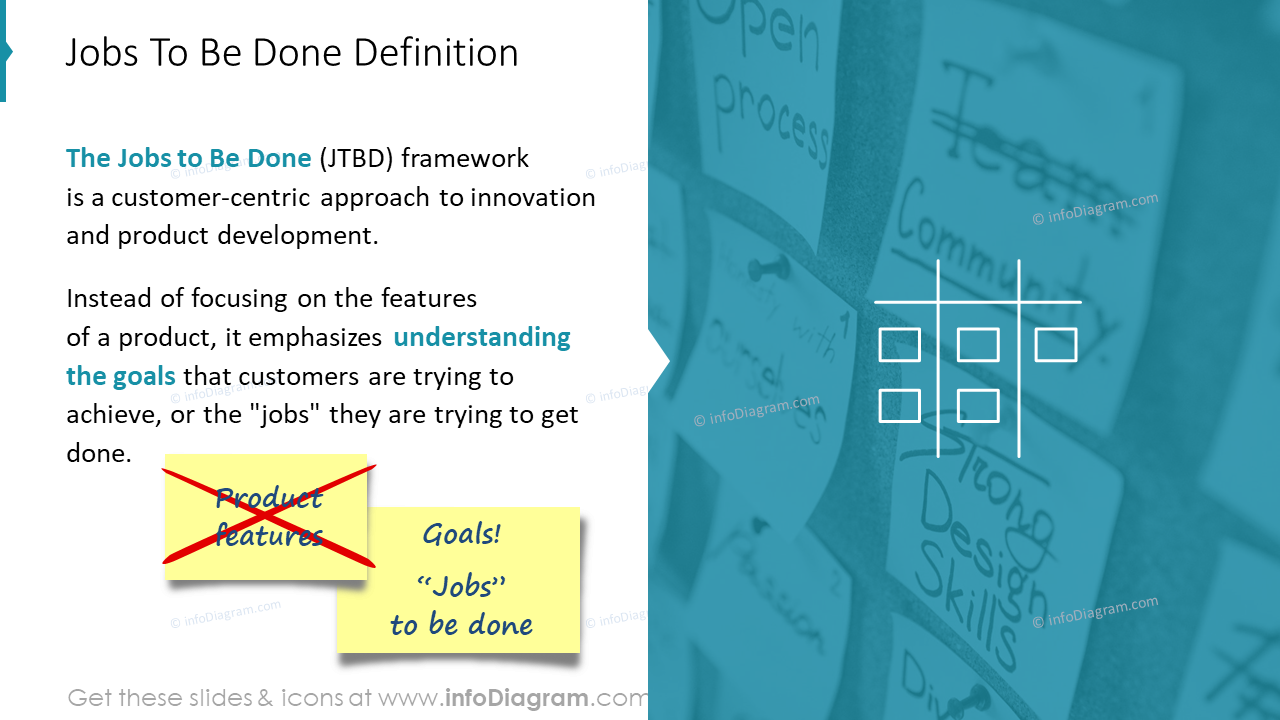
This slide demonstrates how visual elements can complement text, making the content more engaging and memorable.
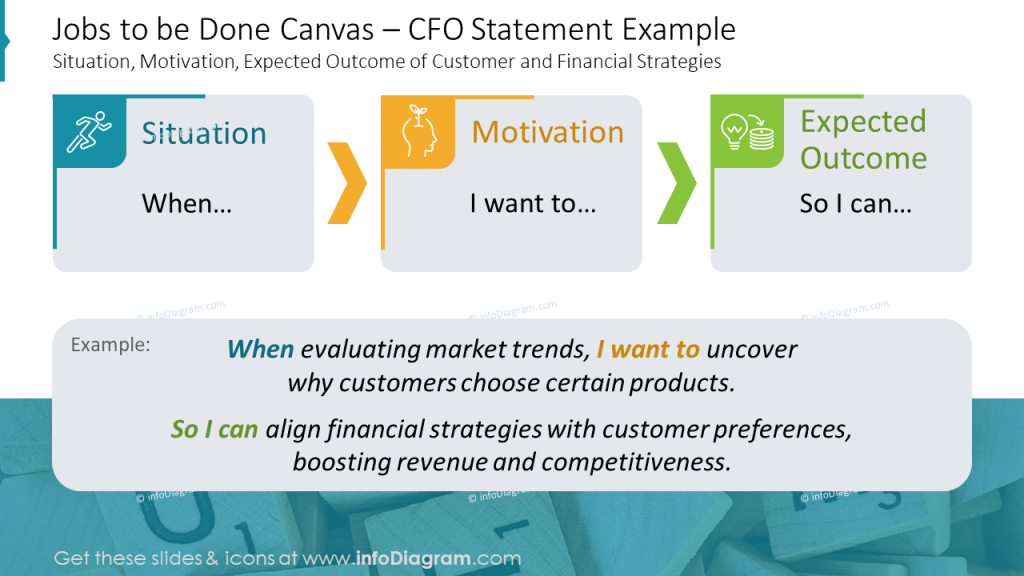
Presenting JTDB Statement examples
On the slide below we present the case of applying JTDB approach to the CFO statement. It contains the three-element simple diagram with visualizations of:
- situation – the icon of the running person
- motivation – the icon of the head with a plant inside
- expected outcome – the icon of the bulb and coins
and then the block with a description of the real-life example. Pay attention to the color coding (words in the definition match the statement colors in the diagram).
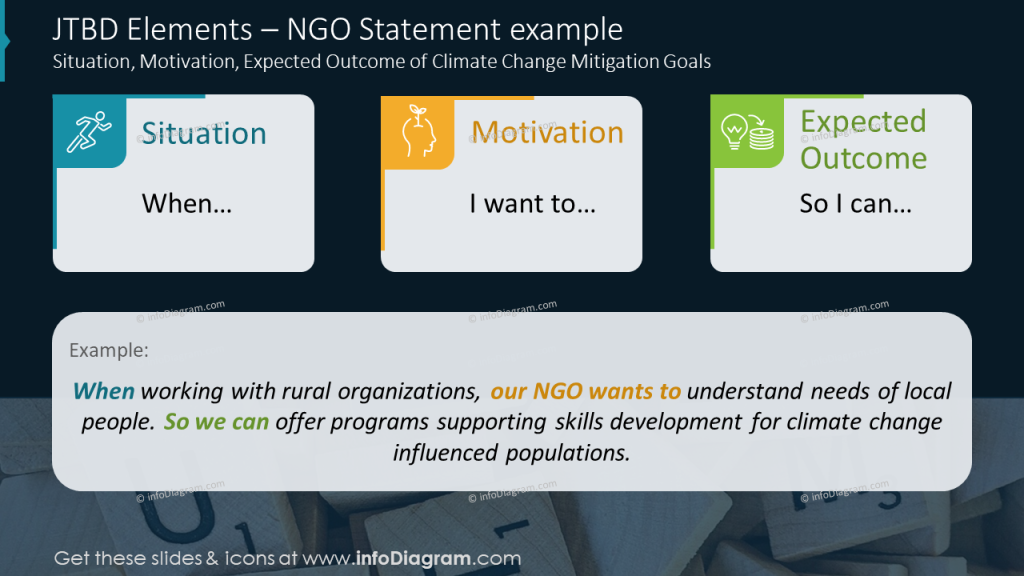
If you want to get extra focus on such a slide with statement visualization, you can use a dark background for a change:
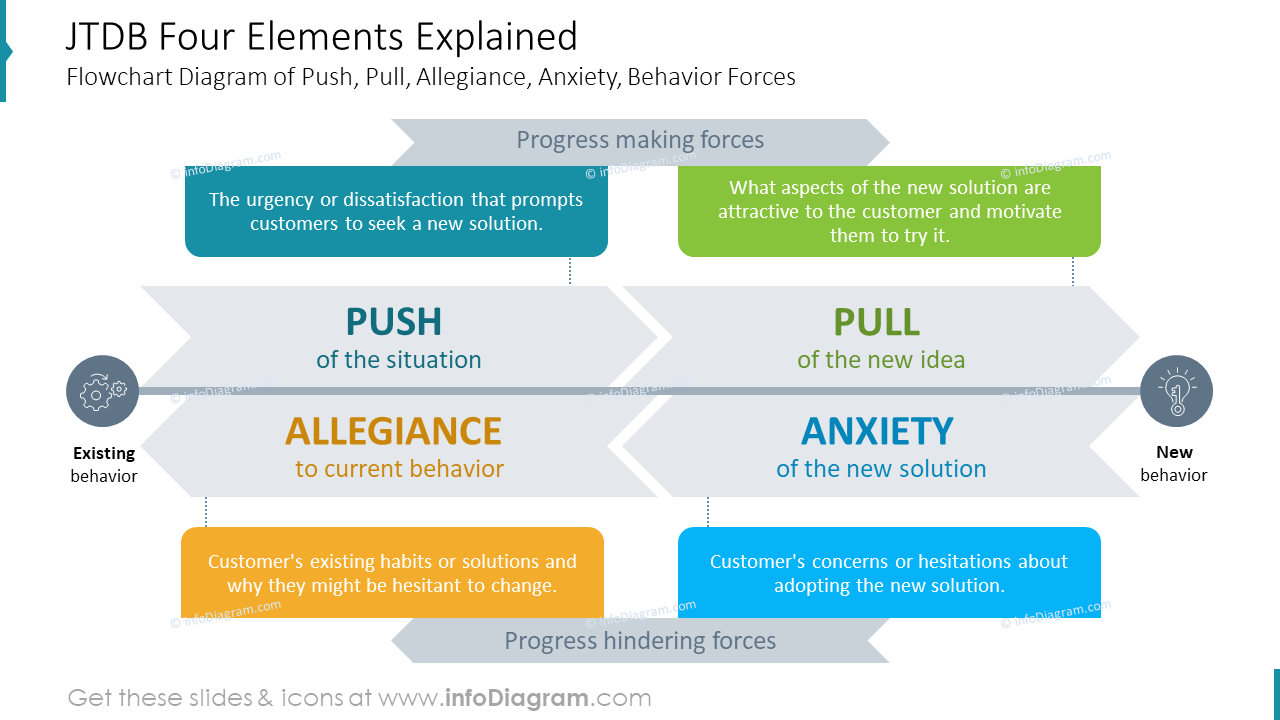
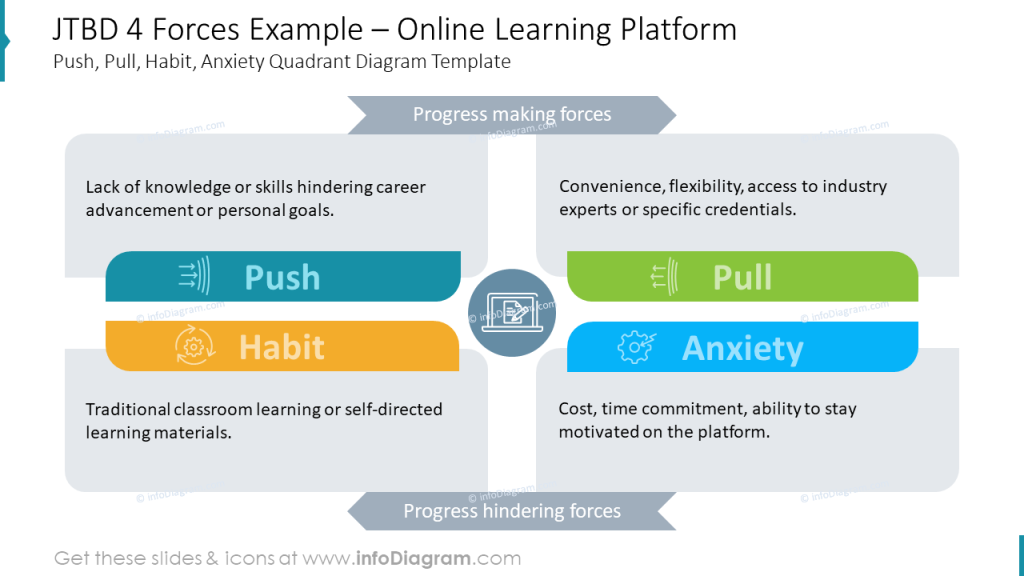
Show what are the key elements of the JTBD framework
The key elements of the JTBD framework are:
- Push of the situation
- Pull of the new idea
- Anxiety of the new solution
- Allegiance to current behavior
A concise list like this is best visualized in a diagram that can also express the flow between the elements. The diagram below fills the entire slide and captures the core essence of the topic. See how we created the diagram with arrow shapes below.n – by row or by column, you can apply simple animation to reveal content parts as you talk about them.
Such theoretical content can be transformed into practical case studies, here is a JTBD example from Online Learning Platform and Healthtech Fitness Tracker:
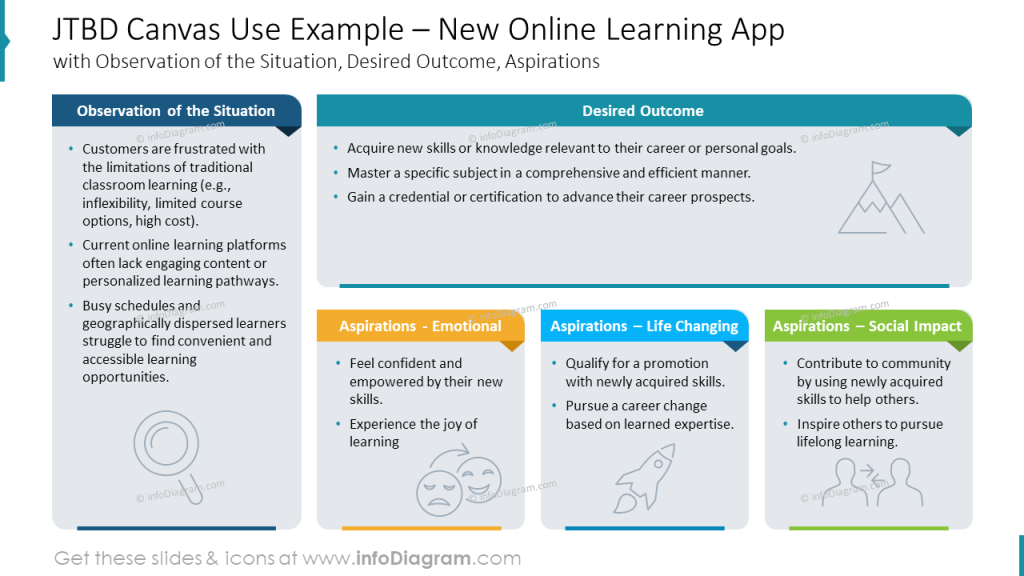
Presenting more detailed info in JTBD Canvas
When you are presenting this framework and you need to add there longer texts , consider using the canvas layout below. It’s designed for sliduument type of presentations, that are fit for reading on screen.
We designed this canvas slide to contain text frames that can contain smaller text blocks and are easy to customize. Each frame has a distinct colored header and a relevant icon, making the text-heavy slide visually appealing and easy to follow
How to do a JTBD analysis? 8 steps of jobs to be done process
To present a process of doing Job To be Done analysis, there are eight typical steps to follow. To show this process in your presentation, instead of writing it as a list of those bullet points:
- Definition step – determining the goals and planning the resources required to complete the job.
- Locate step – focus on gathering the information and items necessary to get started.
- Prepare step – setting up the environment to ensure a smooth execution of the job.
- Confirm step
- Execute step
- Monitor step
- Modify step
- Conclude step
better present the steps visually e.g. by such diagram slide:
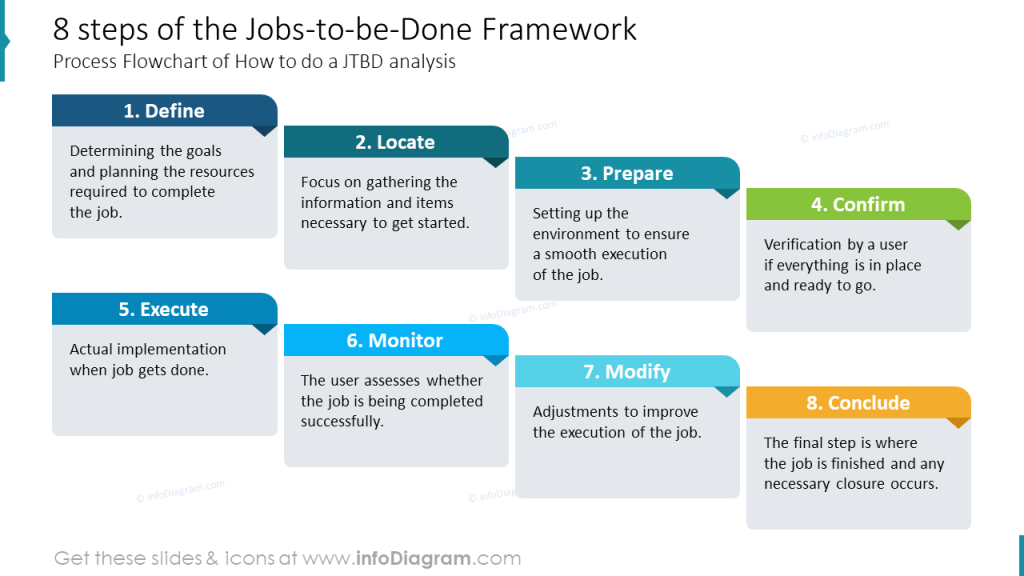
We designed a simple cascade process flowchart that you can easily follow, step by step. Each of the shapes presented on that slide can contain an additional description or example.
Design Tips Summary to Explain Jobs To Be Done Framework visually
If you want to present the JTBD framework using slides in a way that will resonate with your audience, remember a few design rules that will help you to create a professionally looking presentation:
- Enrich text blocks such as term definitions with graphics or pictures.
- Use flowcharts to present processes.
- Visualize lists with colorful diagrams you can refer to.
- Apply icons to represent the specific JTBD concepts. They create a memorable visual association with presented terms.
- Keep the colors and graphical style consistent throughout the whole presentation.
I’m sure that with these basic design rules and tips, you can make a stunning presentation and overall impression.
Resource: JTBD Framework Diagrams PowerPoint Template
The examples above used the graphics from a PowerPoint template on Jobs To Be Done . All slides are available in the infoDiagram collection of presentation graphics:
Check more articles with slide examples related to the topic of work and time management:
- Presenting Eisenhower Time Management Matrix
- Make Engaging OKR and Performance Review Presentations
- Using Strategy Management Pillar Graphics in PowerPoint Presentations
- How to Design Clear and Impressive SMART Goals PPT Slide
Watch the presentation video with slide design ideas:
Watch the guide with quick tips on how to transform an ordinary slide into a more attractive slide: